Vizro-ai
Dashboard generation
Overview
The Vizro python package enables python users to create professional visualisations and dashboards on par with data analysis dedicated programs such as Power BI and Tableau. Reference: https://vizro.readthedocs.io/en/stable/
Vizro AI is a low-code/no-code business intelligence (BI) and data visualization platform designed for rapid dashboard creation. It simplifies the process of data exploration, visualization, and dashboarding using natural language processing (NLP). This allows users to generate insights quickly without extensive coding or technical expertise. Reference: https://vizro.readthedocs.io/projects/vizro-ai/en/vizro-ai-0.3.6/
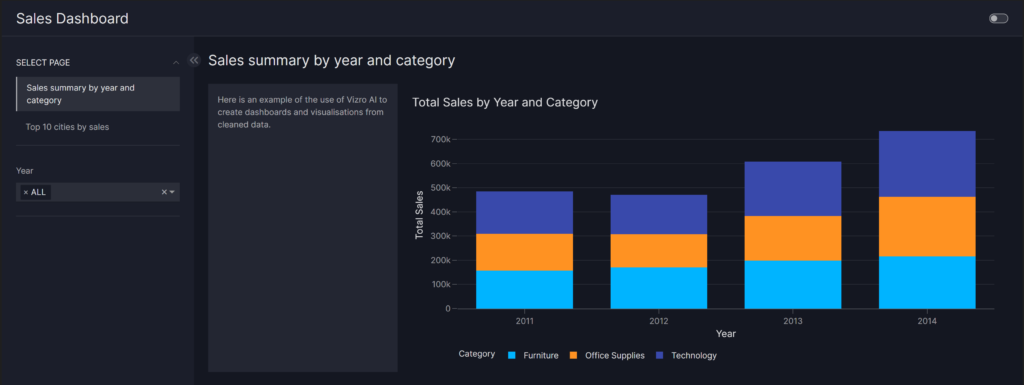
Above, this is the two page dashboard that was created with Vizro-AI when given a large sales dataset (CSV file). While the coding was relatively simple with the importing of packages, setting up of open AI API keys and importing the data. The challenge was adjusting the input for the AI to produce a useful dashboard. In the code below, the input is meticulously worded to ensure the right pages, filters and visualisations were used based on the data imported. As AI evolves, the simple text inputs will allowed to become simpler meanwhile, a data analyst will be able to make more tailored dashboards based on a specific audience or a complex dataset.
Code
import vizro.plotly.express as px
import os
from vizro_ai import VizroAI
from vizro import Vizro
from dotenv import load_dotenv
import pandas as pd
print(vizro_ai.__version__)
# Load environment variables
load_dotenv()
# Retrieve API key safely
OPENAI_API_KEY = os.getenv("OPENAI_API_KEY")
if not OPENAI_API_KEY:
raise ValueError("❌ ERROR: 'OPENAI_API_KEY' is missing. Check your .env file or environment settings.")
# ✅ Set the API key as an environment variable before initializing VizroAI
os.environ["OPENAI_API_KEY"] = OPENAI_API_KEY
# Initialize VizroAI (without parameters)
vizro_ai = VizroAI()
df = pd.read_csv(r"C:\Data Analysis Python\vizroai-project\.venv\Data\sales-data-sample-clean.csv")
#print(df)
user_question = """
There are 2 pages in this dashboard.
Create a the first page showing 1 card, 1 chart. The title of this page is: Sales summary by year and category.
The first card says 'Here is an example of the use of Vizro AI to create dashboards and visualisations from cleaned data.'
Summarise the year column by year, treat as a year date and aggregate based on the category. The aggregated years are whole integers only, for example, 2011 or 2012.
The filter should use these aggregated years also.
The chart is a stacked bar chart showing total sales. Put total sales on the y axis, year on the x axis, and category by colour.
The card takes 1 grid of the page space on the left and the bar chart takes 3 grid space on the right.
Add a filter to filter the bar chart by year (use a calendar to allow filtering in-between 2 dates).
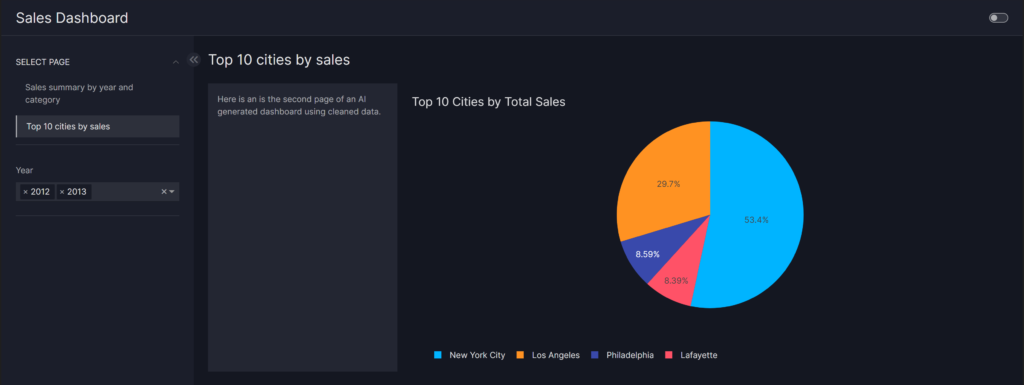
Create a the second page showing 1 card, 1 chart. The title of this page is: Top 10 cities by sales.
The second card says 'Here is an is the second page of an AI generated dashboard using cleaned data.'
Summarise the year column by year, treat as a year date and aggregate based on the category. The aggregated years are whole integers only, for example, 2011 or 2012.
The filter should use these aggregated years also.
The chart is a pie chart showing the top 10 city by total sales. Put total sales as the pie ratio and city by colour.
The card takes 1 grid of the page space on the left and the pie chart takes 3 grid space on the right.
Add a filter to filter the bar chart by year (use a calendar to allow filtering in-between 2 dates).
"""
vizro = Vizro()
vizro_ai = VizroAI(model="gpt-4o")
dashboard = vizro_ai.dashboard([df], user_question)
Vizro().build(dashboard).run()