Amazon sales: India
Sales data analysis
Report: (Give a minute for it to load and some visuals may not work with web embedding from Power BI Service)
https://app.powerbi.com/reportEmbed?reportId=6f212cbd-3048-48aa-86bc-0c02e19c611b&autoAuth=true&ctid=c8a4ce55-bac1-4ebc-98b1-bd3a2a9aa639
Power BI Service Dashboard: (Cannot be directly shared to a website)
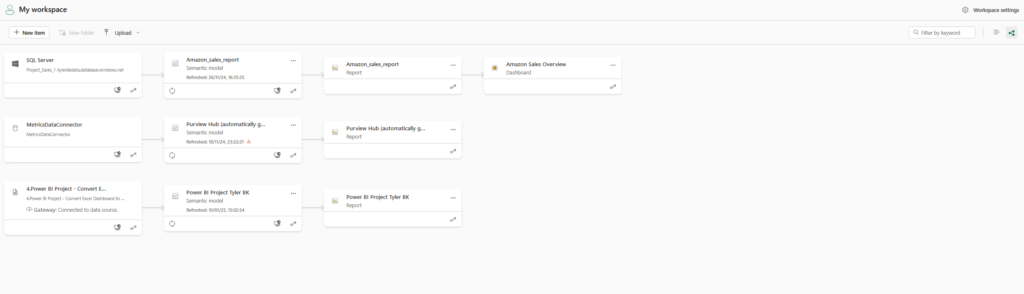
Power BI Service Workspace & data connections: (Cannot be directly shared to a website)
Abstract
This project presents a comprehensive analysis of Amazon sales data within the Indian fashion sector, employing data cleaning, transformation, and visualisation techniques. The raw dataset contained various issues, such as missing values and formatting inconsistencies, which were resolved using Python libraries like Pandas and NumPy. For efficient access and scalability, the cleaned data was uploaded to an Azure SQL database, enabling seamless integration with Microsoft Power BI for analysis. Preliminary exploration in Power BI revealed time gaps in the data; however, meaningful analyses could still be conducted. Key insights included national and international sales trends, regional performance, category-specific analysis, and AI-driven insights. This project demonstrates proficiency in data cleaning, transformation, and visualisation, contributing to data-driven decision-making in the business context.
Initial Data assessment
Source: E-commerce Sales Data on Kaggle
Outline: This dataset provides an in-depth look at the profitability of e-commerce sales and is made of CSV files. It contains data on a variety of sales channels. The columns contain data such as SKU codes, design numbers, stock levels, product categories, sizes and colours. Other key parameters like amount paid by customer for the purchase , rate per piece for every individual transaction Also we have added transactional parameters like Date of sale months category fulfilled by B2b Status Qty Currency Gross amt . The dataset is useful in finding the profitability of e-commerce sales in today’s marketplace.
Completeness: Some significant gaps exist within the dataset. For instance, the dates for national and international sales differ in timeframe and year, preventing direct time-period comparisons. Additionally, international sales lack important details like destination, shipping information, currency, and country, which limits the scope of analyses. Despite these gaps, the dataset still offers potential insights, albeit with constraints on the depth of analysis..
Accuracy: Since this data is sourced from Kaggle, its accuracy cannot be fully verified. However, it serves as a suitable resource for practicing sales data analysis.
Key variables:
- National Amazon Sales
- International Sales
- Inventory Descriptions (by product)
Potential relationships:
- SKU Code
- Order ID
- Index
- Style/Design
Issues and Limitations: See Completeness
Data workflow
- Microsoft Excel: The data was initially downloaded from Kaggle and reviewed in Excel to gain a general understanding and identify any immediate data-cleaning needs.
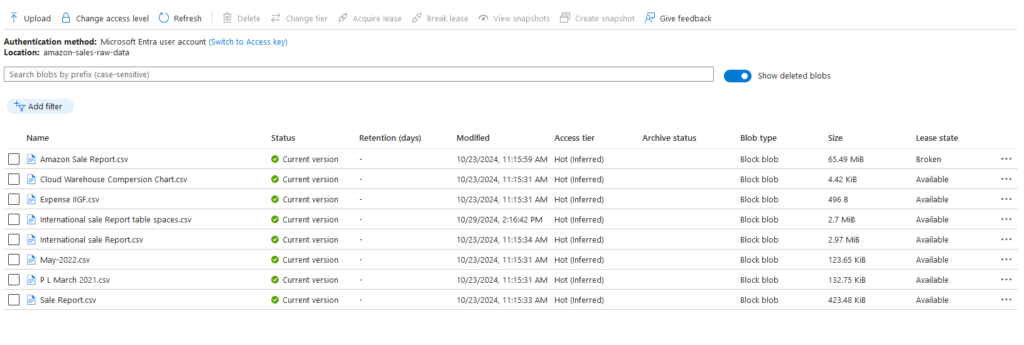
- Azure Blob Storage: The dataset was uploaded to an Azure Blob container to ensure accessibility from any device via the same Microsoft account.
- Python: The data was then imported from Azure Blob into Python, where columns were formatted, data types adjusted, and any null/blank columns were cleaned, with all useful information preserved.
- Azure SQL / SQL Server Management Studio: A SQL database was set up in the Azure cloud and accessed via SQL Server Management Studio. Using the data import tool, the cleaned CSV files were converted into SQL tables within the Azure cloud database.
- Power BI: The cleaned data was connected to Power BI via an SQL import connector. Further formatting and cleanup were done in Power Query for analysis, including setting up a common date table and creating relationships based on date and SKU code. A report with multiple pages and a navigation feature was created, along with DAX measures and visuals to analyse factors like time, region, category, fulfilment, and returns, comparing both national and international sales data.
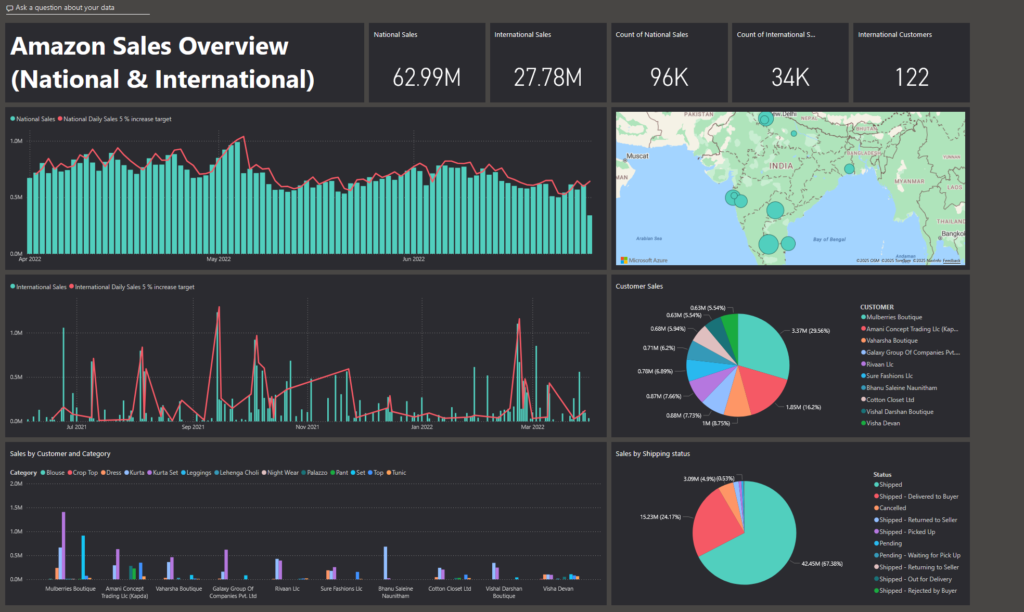
- Power BI Service: The report and the semantic model were uploaded to Power BI service into a workspace. Using the workspace, a dashboard was created to provide an overview of the national and international sales in one page (seen above). This could be shared or promoted to other company members or share holders for example.
Analysis conclusions
Introduction
The goal of this analysis is to identify areas of profitability, trends, and performance across various dimensions of e-commerce sales data.
Overall Sales Performance
Totals : Over the time periods provided in the dataset, the national sales were significantly greater at ₹ 62.99 million (April-May 2022) compared to international at ₹ 27.78 million (June 2021 – March 2022). This includes general sales, with 96,000 sales nationally with 34,000 international sales.
Trends : National sales appear to decrease over time but limited data to predict future trends. International sales fluctuated around ₹ 2 million per month with notable exceptions including October 2021 with sales at ₹ 5.7 million and February 2022 at ₹ 4.5 million.
Top performing products : Sets (unknown type) and Kurta sets are the products with the most sales both national and international. The sets have ₹ 32 million sales nationally (~51 % of national total) with Kurta sets have ₹ 9.9 million sales internationally (~35 % of international total).
Customer Analysis
Main customer (international) : Mullberries Boutique with ₹ 3.37 million sales is the customer with the largest sales, followed by Amani Concept Trading Llc with ₹ 1.85 million sales. The 9th and 10th largest customers are Vishal Darshan Boutique and Visha Devan with sales of ₹ 0.68 million and ₹ 0.63 million respectively.
Customer purchasing (international) : Kurta sets and alternative sets are consistently popular among top international customers.
National Sales Analysis
Sales by region (national) : The region with the most sales is Bengaluru with ₹ 5.9 million sales, with ₹ 4.3 million sales in Mumbai following close. Interestingly, the capital city of India, New Delhi has a total sales of ₹ 3.2 million sales even though it has the highest population in India.
Pricing and Discounts
Effective promotions (national) : There are two successful promotions present in the national sales, Core free shipping and Amazon PLCC free-financing universal with sales using these promotions are ₹ 26 million and ₹ 17 million respectively. The remainder of sales were without promotion of ₹ 18.9 million. By closer analysis, 68% of all national sales used a type of promotion.
Fulfilment analysis (national)
Shipping service level : ₹ 45.7 million sales had expedited shipping compared to only ₹ 17 million with standard shipping. Combine this with effective promotions based on free shipping, customers appear to appreciate fast, free shipping.
Fulfilment : Of the ₹ 62.99 million national sales, ₹ 45.7 million were fulfilled by Amazon with only ₹ 17 million fulfilled by merchants. It would seem Amazon based shipping is faster than merchant fulfilment.
Shipping status : As of the dataset being compiled, 91 % of the sales were shipped or delivered, however, 4.9 % or ₹ 3.09 million of sales were cancelled.
Profitability analysis
Data issue : Due to missing cost and revenue data, a profitability analysis could not be performed.
Key Insights and Recommendations
Key outcomes : This has been an analysis of Amazon sales data based from India. The KPIs of the national and international sales were created along with assessing temporal trends in the sales data. The total sales were broken down into sales by region, product categories, and customer demographics. The influence of promotions and how this affected fulfilment was also investigated.
Recommendations : Comparing national and international sales, while there are more total national sales, there is a lack of sales in high population cities such as New Delhi. A focus on high population cities for sales and expanding international exports would appear to be a lucrative approach. Customers have shown to prefer free expedited shipping with promotions, further promotions like this would likely promote in an increase in sales. In terms of products, sets and Kurtas, these are the best performing products, an expansion on these products and/or into other fashion items could increase future profits.
- Focus on High-Population Areas: Increase efforts in cities like New Delhi to tap into their large potential market.
- Expand International Exports: Target regions with growing demand for Kurta sets and other top-performing products.
- Enhance Promotions: Continue offering free, expedited shipping to boost sales.
- Diversify Products: Expand the product portfolio to capitalise on the success of sets and Kurta sets.
Files / Code
Blob containers:
Python Cleaning Code:
#The CSV Amazon sales data is currently held in an Azure blob in a container, so we need to download it from there with a security key.
#From eyeballing the data in excel, there were a few columns with no useful information and some formatting issues. Firstly some general dataframe analysis checks.
#The dates are using - or / to separate the months and years etc, need to replace to -
#The primary key Order ID has duplicates and NULL values which is an issue for the primary key. These were removed. The Order ID also had - separating numbers, these were removed to make one big number for our key.
#All object columns were stripped to remove any spaces either side of the data values.
#The clean data was saved as a CSV file ready to be uploaded into an Azure SQL database via SQL server management studio (SMSS)

#Library for data manipulation
import pandas as pd

#Installing ability to access blobs and containers
pip install azure-storage-blob pandas

#Installing ability to access blobs and containers
from azure.storage.blob import BlobServiceClient

#Installing ability to access blobs and containers
from io import StringIO

#Connecting to blob
blob_service_client = BlobServiceClient(account_url="URL", credential="BLOB KEY")

container_name = "amazon-sales-raw-data"
blob_name = "Amazon Sale Report.csv"

#Accessing blob container
blob_client = blob_service_client.get_blob_client(container="amazon-sales-raw-data", blob="Amazon Sale Report.csv")

#Downloading blob data as strings
blob_data = blob_client.download_blob().content_as_text()

#Read the data as dataframe
df_amazon_sales_data = pd.read_csv(StringIO(blob_data), low_memory=False)

#Have an eyeball at the data
df_amazon_sales_data

#Show the count of nulls/not-nulls and the datatype of each column
df_amazon_sales_data.info()

#Summary statistics for the numerical columns
df_amazon_sales_data.describe()

#Shows the bottom rows of the data
df_amazon_sales_data.tail()

#Creating a separate variable for the cleaned data
df_amazon_sales_data_cleaned = df_amazon_sales_data

#Ensuring the date column uses only "-" to separate the days/months etc. As there is a mix of / and -.
df_amazon_sales_data_cleaned['Date'] = df_amazon_sales_data_cleaned['Date'].astype(str).str.replace('/', '-', regex=False)

#Convert the date column into the datetime datatype
df_amazon_sales_data_cleaned['Date'] = pd.to_datetime(df_amazon_sales_data_cleaned['Date'])

#Check the bottom rows of data again
df_amazon_sales_data_cleaned.tail()

#Show all the columns in the dataframe
print(list(df_amazon_sales_data_cleaned.columns))

#Remove unwanted columns
df_amazon_sales_data_cleaned = df_amazon_sales_data_cleaned.drop(['Unnamed: 22', 'B2B', 'fulfilled-by'], axis=1)

#Remove any rows with NULL values
df_amazon_sales_data_cleaned = df_amazon_sales_data_cleaned.dropna(subset=['index', 'Order ID', 'Date', 'Status', 'Fulfilment', 'Sales Channel ', 'ship-service-level', 'Style', 'SKU', 'Category', 'Size', 'ASIN', 'Courier Status', 'Qty', 'currency', 'Amount', 'ship-city', 'ship-state', 'ship-postal-code', 'ship-country'])

#Check if there are any NULL values in these columns
print(df_amazon_sales_data_cleaned[['index', 'Order ID', 'Date', 'Status', 'Fulfilment', 'Sales Channel ', 'ship-service-level', 'Style', 'SKU', 'Category', 'Size', 'ASIN', 'Courier Status', 'Qty', 'currency', 'Amount', 'ship-city', 'ship-state', 'ship-postal-code', 'ship-country']].isna().sum())

#Check the columns in the cleaned dataframe
print(list(df_amazon_sales_data_cleaned.columns))

#Check the data types of each column
df_amazon_sales_data_cleaned.info()

#Updates the cleaned dataframe with all columns with object datatype having stripped values with no whitespace
df_amazon_sales_data_cleaned[df_amazon_sales_data_cleaned.select_dtypes(['object']).columns] = df_amazon_sales_data_cleaned.select_dtypes(['object']).apply(lambda x: x.str.strip())

#Check if there any NULL values in the date column
print((df_amazon_sales_data_cleaned['Date'].isna()).sum())

#Check if there any missing values in the date column
print((df_amazon_sales_data_cleaned['Date'] == pd.NaT).sum())

#Check if there any spaces values in the date column
print((df_amazon_sales_data_cleaned['Date'] == '').sum())

#Count the number of duplicated values that are present in the Order ID column, therefore, cannot be used as a primary key currently.
print(df_amazon_sales_data_cleaned['Order ID'].duplicated().sum())

#Removes all duplicate orders in the Order ID column
df_amazon_sales_data_cleaned = df_amazon_sales_data_cleaned[df_amazon_sales_data_cleaned.duplicated(subset=["Order ID"], keep=False) == False]

#Removes the "-" in the Order ID column.
df_amazon_sales_data_cleaned['Order ID'] = df_amazon_sales_data_cleaned['Order ID'].str.replace('-', '', regex=False)

#Check the final cleaned data.
df_amazon_sales_data_cleaned

#Save the cleaned data as a CSV to a folder.
df_amazon_sales_data_cleaned.to_csv(r"FILE PATH", index=False, sep=',', header=True, encoding='utf-8')