Zillow property analysis
Tableau data Project
NOTE: To view the dashboards and story properly, please click the full-screen option (bottom right) on the embedded Tableau file.
Abstract
This project provides an in-depth analysis of property listings in the United States from Zillow, using a Kaggle dataset. The workflow involved data cleaning in Python, summarisation, transformations, identifying relationships, and creating visualisations and dashboards/stories in Tableau. The dataset comprised multiple CSV files detailing various aspects of properties listed on Zillow.
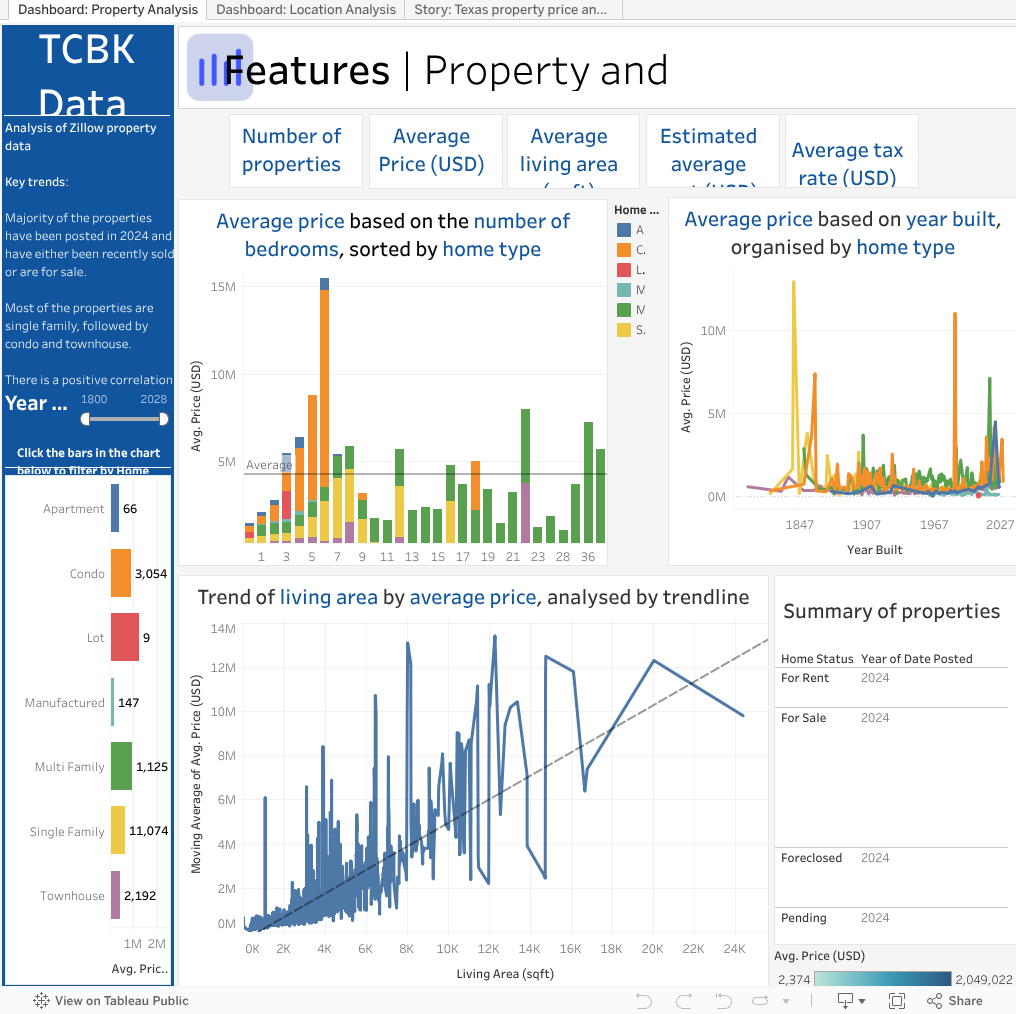
Two dashboards were developed: one focusing on property features and the other on location-based characteristics. Additionally, a Tableau story was created, offering an in-depth analysis of properties in the state of Texas. These deliverables included a range of visualisations, such as bar and line charts, graded maps, and tables. Various filter settings were applied to enhance user interactivity and customisation.
Key findings revealed that most properties were condominiums, with a notable presence of single- and multi-family homes. Property prices varied significantly based on location and size. Location analysis highlighted areas of high and low property value, with school ratings identified as a key factor influencing prices. The Texas story provided a detailed examination of property variations across the state, focusing on price and features.
This project demonstrates my proficiency in using Python for data cleaning and Tableau for creating advanced visualisations and interactive dashboards.
Initial Data assessment
Source: Zillow Real Estate data on Kaggle
Outline:
The Zillow datasets are all in CSV format and encompass a wide range of information. The central fact table contains details of each property, while the other datasets serve as dimension tables, providing additional information such as local school ratings, prices of neighbouring properties, and tax data. Each dataset has unique columns, with the Zpid column used to establish relationships between the tables.
These datasets are ideal for analysing property distribution based on location and correlating it with various property features.
Completeness:
The dataset includes a substantial number of properties, each containing detailed information. However, there were notable null values in fields such as counties or county codes, which were removed during data cleaning. Additionally, some properties appeared to be mislabelled or incorrectly priced on the Zillow website, particularly in terms of the number of bedrooms. These anomalies were also removed to prevent skewing the data.
Accuracy:
Although the data originates from Kaggle, the properties are sourced from the Zillow website and are generally expected to be accurate. However, some discrepancies were identified, such as incorrect entries for the number of bedrooms or bathrooms. These inaccuracies were addressed and removed during the data cleaning process, as detailed in the Completeness section.
Key variables:
- Price
- County
- State
- School rating
- Bedrooms/Bathrooms
Potential relationships:
- Zpid
- State/County
- Year
Issues and Limitations: See Completeness and Accuracy
Data workflow
- Python: See python cleaning code below.
- Tableau: The cleaned data was imported into Tableau, and data types were reviewed and verified. Relationships between the fact table and dimension tables were established using the Zpid column as the primary key. Summary visualisations were initially created to identify key trends within the data. A structured plan for the two dashboards and the Tableau story was developed, outlining the trends to explore during preliminary analysis. Visualisations were created on individual sheets, with interactive filters implemented to enhance usability in the dashboards. These filters and interactions were configured to allow seamless exploration of the data. Finally, the project was uploaded to Tableau Public for presentation.
Analysis conclusions
Please see the Tableau report above
Files / Code
Python preliminary data visualisation:
Python cleaning code:
import pandas as pd
#property_listings
property_listings_cleaned = pd.read_csv("property_listings.csv", low_memory=False)
property_listings_cleaned = pd.DataFrame(property_listings_cleaned)
print(type(property_listings_cleaned))
property_listings_cleaned
property_listings_cleaned.info()
top_10 = property_listings_cleaned.nlargest(10, 'bedrooms')
print(top_10)
property_listings_cleaned = property_listings_cleaned.dropna(subset=['price'])
property_listings_cleaned = property_listings_cleaned[property_listings_cleaned['bedrooms'] != 51268.0]
property_listings_cleaned = property_listings_cleaned[property_listings_cleaned['bedrooms'] != 2070.0]
property_listings_cleaned = property_listings_cleaned[property_listings_cleaned['bedrooms'] != 256.0]
property_listings_cleaned = property_listings_cleaned[property_listings_cleaned['yearBuilt'] != 9999]
property_listings_cleaned = property_listings_cleaned[property_listings_cleaned['yearBuilt'] != 0]
property_listings_cleaned = property_listings_cleaned.dropna(subset=['yearBuilt'])
property_listings_cleaned['zpid'] = property_listings_cleaned['zpid'].astype(int)
property_listings_cleaned['yearBuilt'] = property_listings_cleaned['yearBuilt'].astype(int)
property_listings_cleaned['yearBuilt'] = property_listings_cleaned['yearBuilt'].astype(str)
property_listings_cleaned['yearBuilt']
property_listings_cleaned['yearBuilt'] = pd.to_datetime(property_listings_cleaned['yearBuilt'].astype(str) + '-01-01')
print(type(property_listings_cleaned))
property_listings_cleaned.to_csv(r"C:\Users\tyler\Desktop\DATA\Tableau\Real Estate Project\property_listings_cleaned.csv", index=False, sep=',', header=True, encoding='utf-8')
#listing_tax_info
listing_tax_info_cleaned = pd.read_csv("property_listings.csv", low_memory=False)
listing_tax_info_cleaned = pd.DataFrame(listing_tax_info_cleaned)
print(type(listing_tax_info_cleaned))
listing_tax_info_cleaned
listing_tax_info_cleaned = listing_tax_info_cleaned.dropna(subset=['bedrooms'])
listing_tax_info_cleaned = listing_tax_info_cleaned.dropna(subset=['price'])
listing_tax_info_cleaned['zpid'] = listing_tax_info_cleaned['zpid'].astype(int)
listing_tax_info_cleaned.to_csv(r"C:\Users\tyler\Desktop\DATA\Tableau\Real Estate Project\listing_tax_info_cleaned.csv", index=False, sep=',', header=True, encoding='utf-8')
#listing_subtype
listing_subtype_cleaned = pd.read_csv("listing_subtype.csv", low_memory=False)
listing_subtype_cleaned = pd.DataFrame(listing_subtype_cleaned)
print(type(listing_subtype_cleaned))
listing_subtype_cleaned
listing_subtype_cleaned = listing_subtype_cleaned.dropna()
listing_subtype_cleaned['zpid'] = listing_subtype_cleaned['zpid'].astype(int)
listing_subtype_cleaned.to_csv(r"C:\Users\tyler\Desktop\DATA\Tableau\Real Estate Project\listing_subtype_cleaned.csv", index=False, sep=',', header=True, encoding='utf-8')
#listing_schools_info
listing_schools_cleaned = pd.read_csv("listing_schools_info.csv", low_memory=False)
listing_schools_cleaned = pd.DataFrame(listing_schools_cleaned)
print(type(listing_schools_cleaned))
listing_schools_cleaned
listing_schools_cleaned = listing_schools_cleaned.dropna()
listing_schools_cleaned['zpid'] = listing_schools_cleaned['zpid'].astype(int)
listing_schools_cleaned.to_csv(r"C:\Users\tyler\Desktop\DATA\Tableau\Real Estate Project\listing_schools_cleaned.csv", index=False, sep=',', header=True, encoding='utf-8')
#listing_price_history
listing_price_history_cleaned = pd.read_csv("listing_price_history.csv", low_memory=False)
listing_price_history_cleaned = pd.DataFrame(listing_price_history_cleaned)
print(type(listing_price_history_cleaned))
listing_price_history_cleaned
listing_price_history_cleaned = listing_price_history_cleaned.dropna()
listing_price_history_cleaned['zpid'] = listing_price_history_cleaned['zpid'].astype(int)
listing_price_history_cleaned.to_csv(r"C:\Users\tyler\Desktop\DATA\Tableau\Real Estate Project\listing_price_history_cleaned.csv", index=False, sep=',', header=True, encoding='utf-8')
#listing_nearby_homes
listing_nearby_homes_cleaned = pd.read_csv("listing_nearby_homes.csv", low_memory=False)
listing_nearby_homes_cleaned = pd.DataFrame(listing_nearby_homes_cleaned)
print(type(listing_nearby_homes_cleaned))
listing_nearby_homes_cleaned
listing_nearby_homes_cleaned = listing_nearby_homes_cleaned.dropna()
listing_nearby_homes_cleaned['zpid'] = listing_nearby_homes_cleaned['zpid'].astype(int)
listing_nearby_homes_cleaned.to_csv(r"C:\Users\tyler\Desktop\DATA\Tableau\Real Estate Project\listing_nearby_homes_cleaned.csv", index=False, sep=',', header=True, encoding='utf-8')
#listing_mortgage_info
listing_mortgage_info_cleaned = pd.read_csv("listing_mortgage_info.csv", low_memory=False)
listing_mortgage_info_cleaned = pd.DataFrame(listing_mortgage_info_cleaned)
print(type(listing_mortgage_info_cleaned))
listing_mortgage_info_cleaned
listing_mortgage_info_cleaned = listing_mortgage_info_cleaned.dropna()
listing_mortgage_info_cleaned['zpid'] = listing_mortgage_info_cleaned['zpid'].astype(int)
listing_mortgage_info_cleaned.to_csv(r"C:\Users\tyler\Desktop\DATA\Tableau\Real Estate Project\listing_mortgage_info_cleaned.csv", index=False, sep=',', header=True, encoding='utf-8')
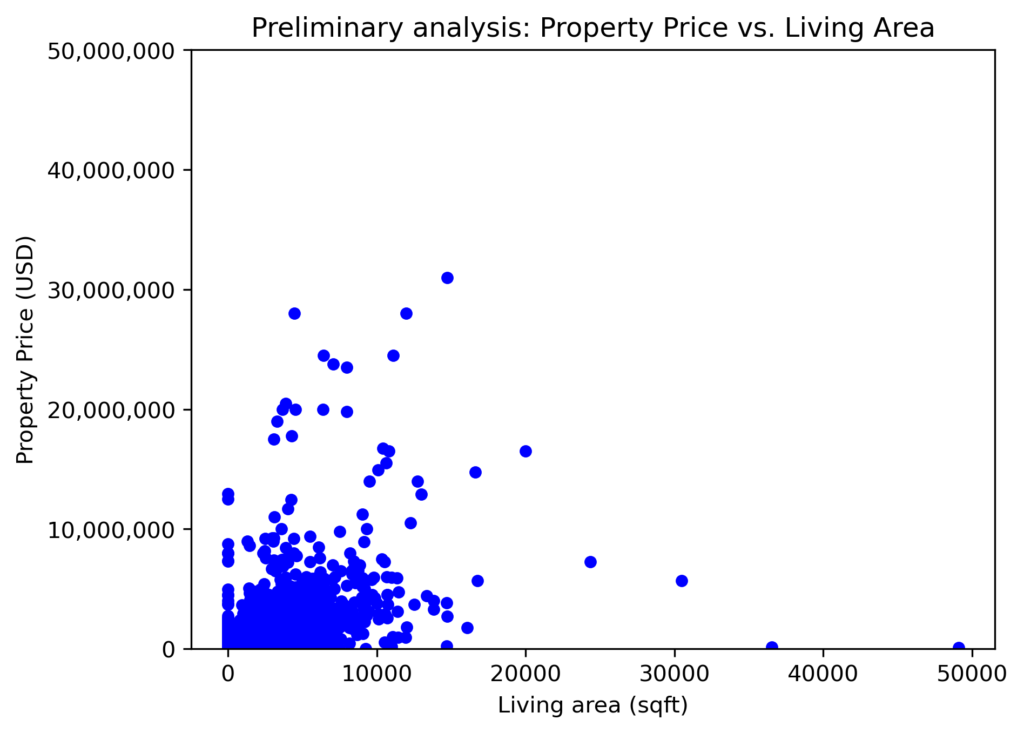
#Preliminary visual analysis
pip install matplotlib
import matplotlib.pyplot as plt
import matplotlib.ticker as mticker
# Scatter plot
plt.scatter(property_listings_cleaned['livingArea'], property_listings_cleaned['price'], color='blue', marker='o', s=20)
# Set y-axis limits for the price
plt.ylim([0, 50000000])
# Set labels for the axes
plt.xlabel('Living area (sqft)')
plt.ylabel('Property Price (USD)')
# Set the title
plt.title('Preliminary analysis: Property Price vs. Living Area')
# Format y-axis to show full numbers with commas
plt.gca().yaxis.set_major_formatter(mticker.StrMethodFormatter('{x:,.0f}'))
# Save the plot as an PNG file
plt.savefig(r'C:\Users\tyler\Desktop\DATA\Tableau\Real Estate Project\property_prices.png', dpi=300, bbox_inches='tight')
# Display the plot
plt.show()