Council Performance KPI Reporting Framework
Power business Intelligance Project
Abstract
This project formed part of my role as Management, Performance & Analytics Officer at Rugby Borough Council.
Senior leaders required a consistent reporting framework through which key performance indicators (KPIs) could be sourced, processed and presented for monthly and quarterly departmental performance reviews.
The data needed to calculate these KPIs was held across numerous systems, including:
- Totalmobile
- Technology Forge
- Civica Cx
- Jigsaw
- SharePoint
- SQL Server databases
- Microsoft Excel workbooks
Power BI was used to connect to these different data sources, transform and standardise the data, calculate the required KPIs using DAX, and present the results through an accessible reporting interface.
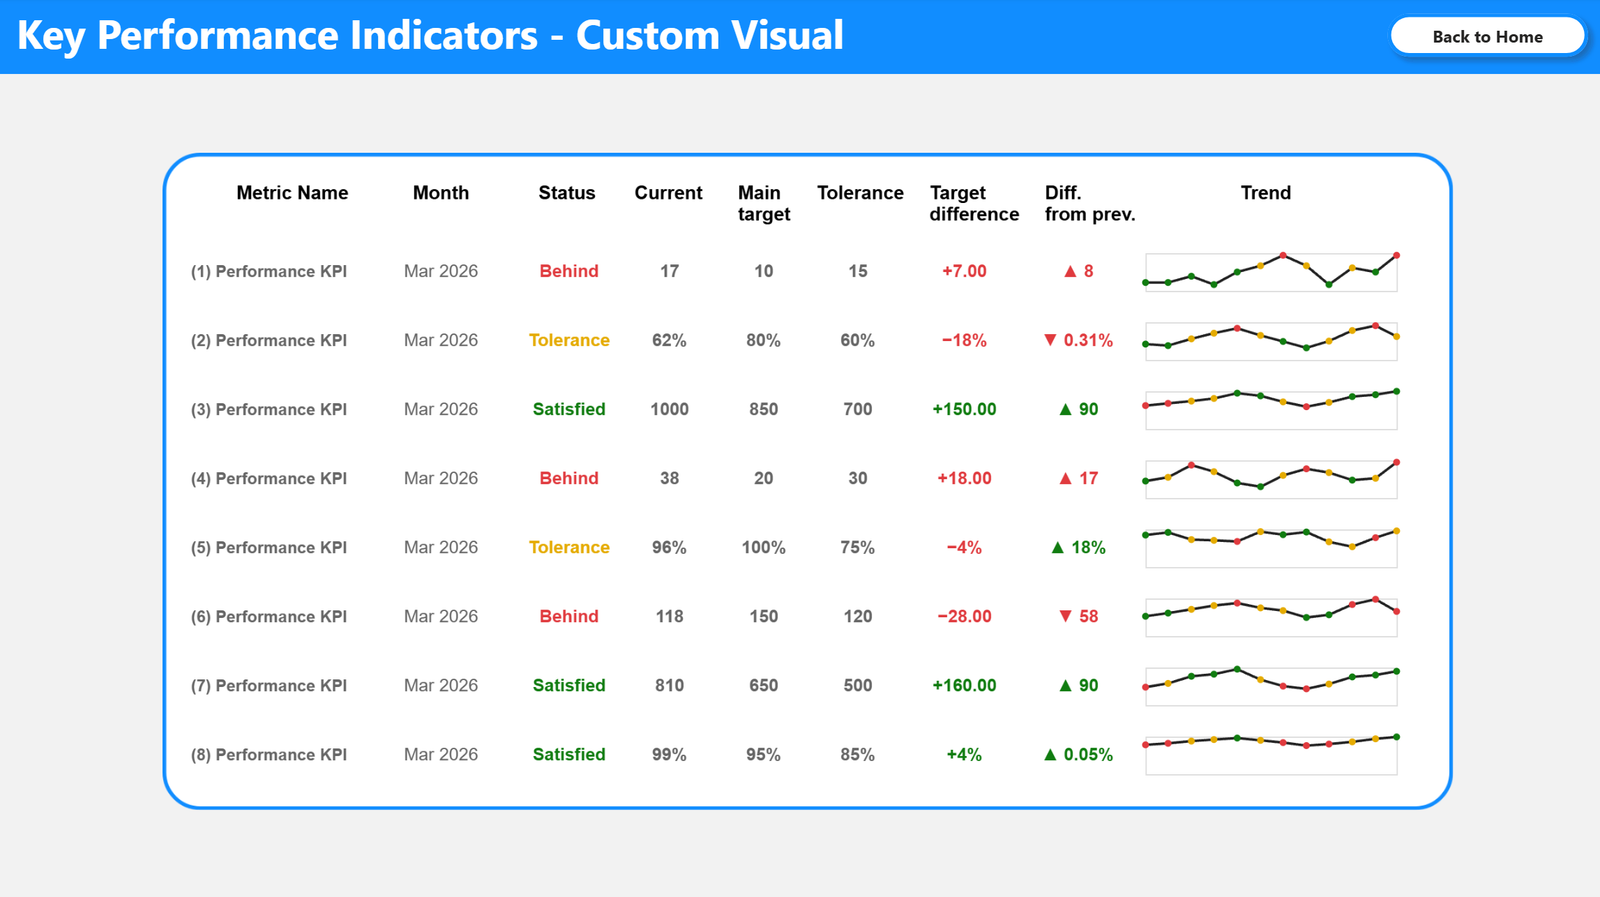
As standard Power BI visuals could not display all the required information clearly within a single view, I developed a custom Vega-Lite visual. This allowed senior leaders to review each KPI’s current performance, previous-month result, target, tolerance threshold, variance and longer-term trend from one compact visual.
Data protection note: The example shown on this page uses dummy data to comply with Rugby Borough Council’s information governance requirements. No live council or customer information is displayed. The dummy data is sufficient to demonstrate the design, functionality and implementation of the reporting solution.
Data Analytics Lifecycle
1. Plan
Departmental managers were the principal stakeholders for the project. Initial discussions were used to understand how they reviewed performance, what information they needed and how the reports would be used during senior leadership meetings.
The core requirements were to:
- Display all relevant KPIs for each department.
- Show the current reporting month and previous month’s result.
- Display the main target and any tolerance threshold.
- Clearly indicate whether performance was on target, within tolerance or outside tolerance.
- Calculate the difference between the current result and the target.
- Show the change from the previous reporting period.
- Present longer-term performance trends.
- Make the information understandable to managers outside the department responsible for the KPI.
The intention was to provide this information within a single visual or report page, reducing the need for users to move between several charts, tables and spreadsheets during performance meetings.
2. Prepare
The planning stage identified several technical and operational considerations.
The volume of information required for each KPI meant that a standard Power BI visual was unlikely to provide a sufficiently clear and compact solution. An external visual therefore needed to be introduced or a bespoke visual developed. This increased the initial development time but provided greater control over the layout and user experience.
Each department also used different systems and recorded information in different formats. Due to the number of KPIs involved, separate departmental reports were required to organise the data effectively and prevent individual reports from becoming unnecessarily large or difficult to maintain.
Access to each source system had to be requested through the officers responsible for maintaining the relevant databases and applications. Connectivity between Power BI and each source was then tested before the reporting model could be developed.
Regular manager feedback was built into the project plan. Departmental managers understood the operational meaning of their KPIs, while the analytics process converted those requirements into consistent calculations and accessible visual outputs.
The reports also needed to be understandable across departments. Clear KPI names, descriptions, labels, status indicators and explanatory tooltips were therefore essential.
3. Process and Transform
Once access had been granted, the data was connected to Power BI and processed through Power Query.
The transformation process included:
- Correcting inconsistent data types and date formats.
- Removing unnecessary columns to improve report performance.
- Identifying and resolving data-quality errors.
- Standardising department, service and KPI labels.
- Removing or managing duplicate records.
- Creating consistent reporting-period fields.
- Combining information from multiple systems where required.
- Structuring the data so that it could be used reliably within the Power BI data model.
The transformation steps were designed to be repeatable so that reports could be refreshed without manually repeating the same data-cleaning processes each month.
4. Analysis and Modelling
After the data had been cleaned, it was organised into a structured Power BI data model.
Calculated columns were created where row-level classifications or supporting values were required. DAX measures were then developed for:
- Current KPI performance.
- Previous-month performance.
- Monthly change.
- KPI targets.
- Tolerance thresholds.
- Variance from target.
- Performance status.
- Trend calculations.
- Supporting values displayed within tooltips.
The model also needed to accommodate KPIs with different formats. Some measures were percentages, while others represented days, totals, monetary values or decimal averages. Formatting and status logic therefore had to be adapted according to the type and direction of each KPI.
For example, a higher percentage may indicate improved performance for one KPI, whereas a lower number of days may represent improved performance for another. The status calculations had to account for these differences to prevent misleading results.
5. Visual Development
A custom Vega-Lite visual was developed to display the required information in a compact and consistent format.
Each KPI row included:
- KPI name and reference.
- Current performance.
- Previous-month performance.
- Main target.
- Tolerance threshold.
- Current status.
- Variance from target.
- Change from the previous month.
- A sparkline showing the longer-term trend.
Conditional formatting allowed performance to be interpreted quickly, while the sparklines provided context that could not be obtained from the current result alone.
Interactive tooltips were added to the sparklines so users could examine individual reporting periods and view more detailed values without overcrowding the main visual.
6. Refine and Compare
The visual was refined through feedback from departmental managers and senior users.
Changes made following feedback included:
- Adding tooltips to the KPI sparklines.
- Reorganising the layout so the target, tolerance threshold, current result and status were positioned together.
- Improving the wording of KPI names and descriptions.
- Adjusting the order in which KPIs appeared.
- Making status indicators easier to interpret.
- Improving consistency between departmental reports.
- Ensuring the visual remained understandable when viewed by managers from other service areas.
This iterative process improved both the usability of the reports and the efficiency of performance discussions.
7. Communicate and Implement
The completed reports were introduced into senior leadership and departmental performance panels.
Guidance was provided to managers on:
- Navigating the reports.
- Interpreting performance statuses.
- Using the sparklines and tooltips.
- Identifying movement from the previous month.
- Distinguishing between the main target and tolerance threshold.
- Using the information to support further investigation and management action.
The reports were published to the council’s analytics environment and shared through SharePoint, providing authorised users with a consistent location from which to access the latest performance information.
Outcomes and Feedback
The project replaced fragmented performance information with a clearer and more consistent reporting framework.
The custom visual enabled users to assess:
- The current position of each KPI.
- Whether the KPI was meeting its target.
- Whether performance remained within an agreed tolerance.
- The size of the variance from target.
- How performance had changed since the previous month.
- Whether the longer-term trend was improving, declining or remaining stable.
Bringing this information together reduced the need to compare multiple spreadsheets, tables and charts during performance reviews.
The consistent layout also made it easier for senior managers to review performance outside their own service area. This supported more informed discussions and helped users identify KPIs that required further investigation or management action.
Key Outcomes
- Connected data from multiple council systems and databases within Power BI.
- Developed repeatable Power Query processes to clean and standardise the data.
- Built DAX measures for KPI results, targets, tolerances, variances and status classifications.
- Designed a custom Vega-Lite KPI visual that displayed detailed information without overcrowding the report.
- Introduced trend analysis through sparklines and interactive tooltips.
- Created a consistent reporting structure for departmental and senior leadership reviews.
- Improved the accessibility and interpretation of performance information.
- Used stakeholder feedback to refine the visual design and reporting experience.
Limitations
The principal limitation was the relative rigidity of the custom visual and its supporting calculated table.
Although the reporting framework supported monthly and quarterly performance reviews, the visual could not dynamically switch between monthly and quarterly layouts. Users were also unable to select any reporting month directly within the visual because its structure depended on predefined calculations for the current and previous reporting periods.
The bespoke nature of the visual also meant that changes to its layout or the addition of new fields required more development work than would normally be needed for a standard Power BI visual.
Recommendations and Future Development
Future development could include:
- Rebuilding the supporting model so users can select any reporting month.
- Adding a toggle between monthly and quarterly performance.
- Developing a dynamic comparison-period measure.
- Introducing drill-through pages for detailed KPI analysis.
- Adding written management commentary and recorded improvement actions.
- Including automated data-quality warnings where information is missing or incomplete.
- Creating a consistent KPI metadata table containing ownership, definitions, targets and reporting frequencies.
- Introducing role-based views so managers can quickly access the KPIs most relevant to their service.
- Investigating whether newer Power BI or Vega-Lite functionality could reduce the rigidity of the original visual.
Reflection
This project demonstrated the importance of combining technical development with stakeholder engagement.
The main challenge was not simply calculating the KPIs. It was bringing together data from several systems, interpreting different operational definitions and presenting a large amount of information in a way that remained clear and useful.
Developing the custom visual strengthened my experience in Power Query, DAX, data modelling, Vega-Lite and user-centred report design. It also demonstrated the value of iterative development: feedback from the managers using the reports directly informed improvements to the layout, wording and interactive features.
The resulting framework provided senior leaders with a clearer and more efficient way to review performance, compare results against targets and identify areas requiring further action.
Code & Screenshots
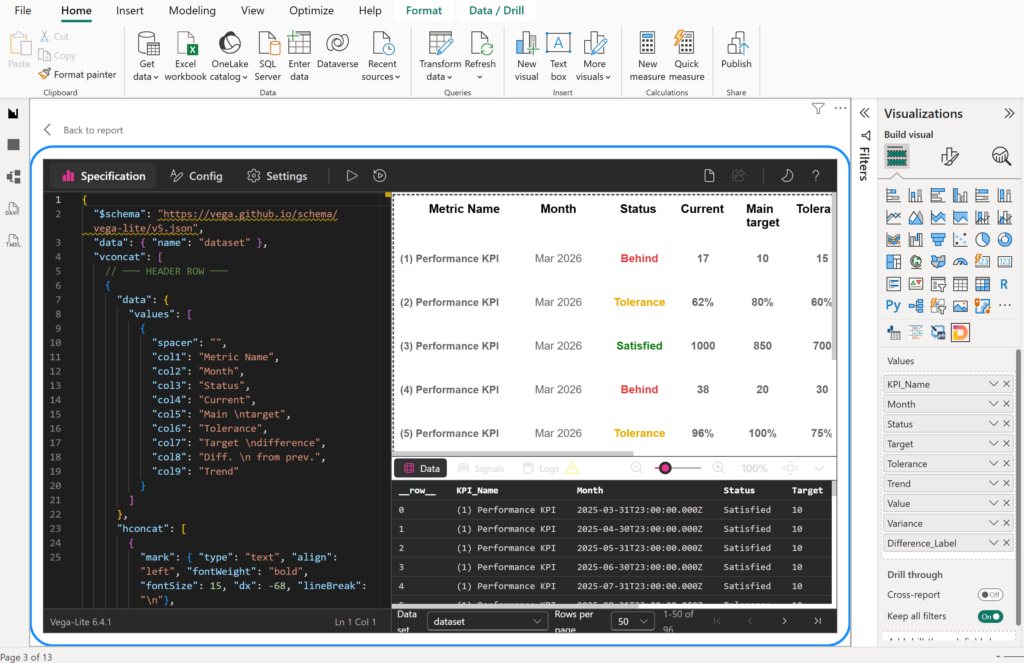
DAX: Calculated Table for the KPI visual.
Panel 1 - Senior Leader Panel =
VAR PrevMonthEnd = EOMONTH(TODAY(), -1)
RETURN
UNION(
-- ─────── KPI 2 ───────
SELECTCOLUMNS(
ADDCOLUMNS(
FILTER(
SUMMARIZE('Dates: DateTable', 'Dates: DateTable'[MonthStart]),
'Dates: DateTable'[MonthStart] >= DATE(2025,4,1)
&& 'Dates: DateTable'[MonthStart] <= PrevMonthEnd
),
"KPI_Name", "(2) Avg days to complete responsive repair",
"Value",
CALCULATE(
[2_KPI: Average Number of WorkDays to complete a routine repair],
TREATAS({ 'Dates: DateTable'[MonthStart] }, 'Data PRS 1_6: Orders'[MonthStart])
),
"Trend",
FORMAT(
CALCULATE(
[2_KPI: Average Number of WorkDays to complete a routine repair],
TREATAS({ 'Dates: DateTable'[MonthStart] }, 'Data PRS 1_6: Orders'[MonthStart])
), "0.0"),
"Target", [2_KPI_T: Average Number of WorkDays to complete a routine repair],
"Tolerance", [2_KPI_LT: Average Number of WorkDays to complete a routine repair],
"Variance",
CALCULATE(
[2_KPI: Average Number of WorkDays to complete a routine repair],
TREATAS({ 'Dates: DateTable'[MonthStart] }, 'Data PRS 1_6: Orders'[MonthStart])
) - [2_KPI_T: Average Number of WorkDays to complete a routine repair],
"Status",
SWITCH(
TRUE(),
CALCULATE(
[2_KPI: Average Number of WorkDays to complete a routine repair],
TREATAS({ 'Dates: DateTable'[MonthStart] }, 'Data PRS 1_6: Orders'[MonthStart])
) > [2_KPI_LT: Average Number of WorkDays to complete a routine repair], "Behind",
CALCULATE(
[2_KPI: Average Number of WorkDays to complete a routine repair],
TREATAS({ 'Dates: DateTable'[MonthStart] }, 'Data PRS 1_6: Orders'[MonthStart])
) > [2_KPI_T: Average Number of WorkDays to complete a routine repair], "Tolerance",
"Satisfied"
),
"Difference_Label",
VAR CurrentValue2 =
CALCULATE(
[2_KPI: Average Number of WorkDays to complete a routine repair],
TREATAS({ 'Dates: DateTable'[MonthStart] }, 'Data PRS 1_6: Orders'[MonthStart])
)
VAR PrevValue2 =
CALCULATE(
[2_KPI: Average Number of WorkDays to complete a routine repair],
TREATAS({ EDATE('Dates: DateTable'[MonthStart], -1) }, 'Data PRS 1_6: Orders'[MonthStart])
)
VAR Diff2 = CurrentValue2 - PrevValue2
RETURN
IF(
ISBLANK(Diff2) || ISBLANK(PrevValue2),
BLANK(),
IF(
Diff2 > 0,
"▲ " & FORMAT(Diff2, "0.0"),
IF(
Diff2 < 0,
"▼ " & FORMAT(ABS(Diff2), "0.0"),
"→ 0.0"
)
)
)
),
"KPI_Name", [KPI_Name],
"Month", [MonthStart],
"Value", [Value],
"TimeValue", "",
"Trend", [Trend],
"Target", [Target],
"Tolerance",[Tolerance],
"Variance", [Variance],
"Status", [Status],
"Difference_Label", [Difference_Label]
),
-- ─────── KPI 3 ───────
SELECTCOLUMNS(
ADDCOLUMNS(
FILTER(
SUMMARIZE('Dates: DateTable', 'Dates: DateTable'[MonthStart]),
'Dates: DateTable'[MonthStart] >= DATE(2025,4,1)
&& 'Dates: DateTable'[MonthStart] <= PrevMonthEnd
),
"KPI_Name", "(3) Avg days to complete major repair",
"Value",
CALCULATE(
[3_KPI: Average Number of WorkDays to complete a major repair],
TREATAS({ 'Dates: DateTable'[MonthStart] }, 'Data PRS 1_6: Orders'[MonthStart])
),
"Trend",
FORMAT(
CALCULATE(
[3_KPI: Average Number of WorkDays to complete a major repair],
TREATAS({ 'Dates: DateTable'[MonthStart] }, 'Data PRS 1_6: Orders'[MonthStart])
),"0.0"),
"Target", [3_KPI_T: Average Number of WorkDays to complete a major repair],
"Tolerance", [3_KPI_LT: Average Number of WorkDays to complete a major repair],
"Variance",
CALCULATE(
[3_KPI: Average Number of WorkDays to complete a major repair],
TREATAS({ 'Dates: DateTable'[MonthStart] }, 'Data PRS 1_6: Orders'[MonthStart])
) - [3_KPI_T: Average Number of WorkDays to complete a major repair],
"Status",
SWITCH(
TRUE(),
CALCULATE(
[3_KPI: Average Number of WorkDays to complete a major repair],
TREATAS({ 'Dates: DateTable'[MonthStart] }, 'Data PRS 1_6: Orders'[MonthStart])
) > [3_KPI_LT: Average Number of WorkDays to complete a major repair], "Behind",
CALCULATE(
[3_KPI: Average Number of WorkDays to complete a major repair],
TREATAS({ 'Dates: DateTable'[MonthStart] }, 'Data PRS 1_6: Orders'[MonthStart])
) > [3_KPI_T: Average Number of WorkDays to complete a major repair], "Tolerance",
"Satisfied"
),
"Difference_Label",
VAR CurrentValue2 =
CALCULATE(
[3_KPI: Average Number of WorkDays to complete a major repair],
TREATAS({ 'Dates: DateTable'[MonthStart] }, 'Data PRS 1_6: Orders'[MonthStart])
)
VAR PrevValue2 =
CALCULATE(
[3_KPI: Average Number of WorkDays to complete a major repair],
TREATAS({ EDATE('Dates: DateTable'[MonthStart], -1) }, 'Data PRS 1_6: Orders'[MonthStart])
)
VAR Diff2 = CurrentValue2 - PrevValue2
RETURN
IF(
ISBLANK(Diff2) || ISBLANK(PrevValue2),
BLANK(),
IF(
Diff2 > 0,
"▲ " & FORMAT(Diff2, "0.0"),
IF(
Diff2 < 0,
"▼ " & FORMAT(ABS(Diff2), "0.0"),
"→ 0.0"
)
)
)
),
"KPI_Name", [KPI_Name],
"Month", [MonthStart],
"Value", [Value],
"TimeValue", "",
"Trend", [Trend],
"Target", [Target],
"Tolerance",[Tolerance],
"Variance", [Variance],
"Status", [Status],
"Difference_Label", [Difference_Label]
),
-- ─────── KPI 5 ───────
SELECTCOLUMNS(
ADDCOLUMNS(
FILTER(
SUMMARIZE('Dates: DateTable', 'Dates: DateTable'[MonthStart]),
'Dates: DateTable'[MonthStart] >= DATE(2025,4,1)
&& 'Dates: DateTable'[MonthStart] <= PrevMonthEnd
),
"KPI_Name", "(5) Emergency Repairs completed within target timescales",
"Value",
CALCULATE(
[5_KPI: Emergency Repairs completed within target timescales (%)],
TREATAS({ 'Dates: DateTable'[MonthStart] }, 'Data PRS 1_2: All Emergency Completed Orders'[MonthStart])
),
"Trend",
FORMAT(
CALCULATE(
[5_KPI: Emergency Repairs completed within target timescales (%)],
TREATAS({ 'Dates: DateTable'[MonthStart] }, 'Data PRS 1_2: All Emergency Completed Orders'[MonthStart])
),"0.0%"),
"Target", [5_KPI_T: Emergency Repairs completed within target timescales],
"Tolerance", [5_KPI_LT: Emergency Repairs completed within target timescales],
"Variance",
CALCULATE(
[5_KPI: Emergency Repairs completed within target timescales (%)],
TREATAS({ 'Dates: DateTable'[MonthStart] }, 'Data PRS 1_2: All Emergency Completed Orders'[MonthStart])
) - [5_KPI_T: Emergency Repairs completed within target timescales],
"Status",
SWITCH(
TRUE(),
CALCULATE(
[5_KPI: Emergency Repairs completed within target timescales (%)],
TREATAS({ 'Dates: DateTable'[MonthStart] }, 'Data PRS 1_2: All Emergency Completed Orders'[MonthStart])
) < [5_KPI_LT: Emergency Repairs completed within target timescales], "Behind",
CALCULATE(
[5_KPI: Emergency Repairs completed within target timescales (%)],
TREATAS({ 'Dates: DateTable'[MonthStart] }, 'Data PRS 1_2: All Emergency Completed Orders'[MonthStart])
) < [5_KPI_T: Emergency Repairs completed within target timescales], "Tolerance",
"Satisfied"
),
"Difference_Label",
VAR CurrentValue2 =
CALCULATE(
[5_KPI: Emergency Repairs completed within target timescales (%)],
TREATAS({ 'Dates: DateTable'[MonthStart] }, 'Data PRS 1_2: All Emergency Completed Orders'[MonthStart])
)
VAR PrevValue2 =
CALCULATE(
[5_KPI: Emergency Repairs completed within target timescales (%)],
TREATAS({ EDATE('Dates: DateTable'[MonthStart], -1) }, 'Data PRS 1_2: All Emergency Completed Orders'[MonthStart])
)
VAR Diff2 = CurrentValue2 - PrevValue2
RETURN
IF(
ISBLANK(Diff2) || ISBLANK(PrevValue2),
BLANK(),
IF(
Diff2 > 0,
"▲ " & FORMAT(Diff2, "0.0%"),
IF(
Diff2 < 0,
"▼ " & FORMAT(ABS(Diff2), "0.0%"),
"→ 0.0%"
)
)
)
),
"KPI_Name", [KPI_Name],
"Month", [MonthStart],
"Value", [Value],
"TimeValue", "",
"Trend", [Trend],
"Target", [Target],
"Tolerance",[Tolerance],
"Variance", [Variance],
"Status", [Status],
"Difference_Label", [Difference_Label]
),
-- ─────── KPI 6 ───────
SELECTCOLUMNS(
ADDCOLUMNS(
FILTER(
SUMMARIZE('Dates: DateTable', 'Dates: DateTable'[MonthStart]),
'Dates: DateTable'[MonthStart] >= DATE(2025,4,1)
&& 'Dates: DateTable'[MonthStart] <= PrevMonthEnd
),
"KPI_Name", "(6) Non-Emergency Repairs completed within target timescales",
"Value",
CALCULATE(
[6_KPI:Non-Emergency Repairs completed within target timescales (%)],
TREATAS({ 'Dates: DateTable'[MonthStart] }, 'Data PRS 1_6: Orders'[MonthStart])
),
"Trend",
FORMAT(
CALCULATE(
[6_KPI:Non-Emergency Repairs completed within target timescales (%)],
TREATAS({ 'Dates: DateTable'[MonthStart] }, 'Data PRS 1_6: Orders'[MonthStart])
),"0.0%"),
"Target", [6_KPI_T: Non-Emergency Repairs completed within target timescales],
"Tolerance", [6_KPI_LT: Non-Emergency Repairs completed within target timescales],
"Variance",
CALCULATE(
[6_KPI:Non-Emergency Repairs completed within target timescales (%)],
TREATAS({ 'Dates: DateTable'[MonthStart] }, 'Data PRS 1_6: Orders'[MonthStart])
) - [6_KPI_T: Non-Emergency Repairs completed within target timescales],
"Status",
SWITCH(
TRUE(),
CALCULATE(
[6_KPI:Non-Emergency Repairs completed within target timescales (%)],
TREATAS({ 'Dates: DateTable'[MonthStart] }, 'Data PRS 1_6: Orders'[MonthStart])
) < [6_KPI_LT: Non-Emergency Repairs completed within target timescales], "Behind",
CALCULATE(
[6_KPI:Non-Emergency Repairs completed within target timescales (%)],
TREATAS({ 'Dates: DateTable'[MonthStart] }, 'Data PRS 1_6: Orders'[MonthStart])
) < [6_KPI_T: Non-Emergency Repairs completed within target timescales], "Tolerance",
"Satisfied"
),
"Difference_Label",
VAR CurrentValue2 =
CALCULATE(
[6_KPI:Non-Emergency Repairs completed within target timescales (%)],
TREATAS({ 'Dates: DateTable'[MonthStart] }, 'Data PRS 1_6: Orders'[MonthStart])
)
VAR PrevValue2 =
CALCULATE(
[6_KPI:Non-Emergency Repairs completed within target timescales (%)],
TREATAS({ EDATE('Dates: DateTable'[MonthStart], -1) }, 'Data PRS 1_6: Orders'[MonthStart])
)
VAR Diff2 = CurrentValue2 - PrevValue2
RETURN
IF(
ISBLANK(Diff2) || ISBLANK(PrevValue2),
BLANK(),
IF(
Diff2 > 0,
"▲ " & FORMAT(Diff2, "0.0%"),
IF(
Diff2 < 0,
"▼ " & FORMAT(ABS(Diff2), "0.0%"),
"→ 0.0%"
)
)
)
),
"KPI_Name", [KPI_Name],
"Month", [MonthStart],
"Value", [Value],
"TimeValue", "",
"Trend", [Trend],
"Target", [Target],
"Tolerance",[Tolerance],
"Variance", [Variance],
"Status", [Status],
"Difference_Label", [Difference_Label]
),
-- ─────── KPI 8 ───────
SELECTCOLUMNS(
ADDCOLUMNS(
FILTER(
SUMMARIZE('Dates: DateTable', 'Dates: DateTable'[MonthStart]),
'Dates: DateTable'[MonthStart] >= DATE(2025,4,1)
&& 'Dates: DateTable'[MonthStart] <= PrevMonthEnd
),
"KPI_Name", "(8) Subcontractor use - Responsive Repairs",
"Value",
CALCULATE(
[8_KPI Subcontractor use - Responsive Repairs (%)],
TREATAS({ 'Dates: DateTable'[MonthStart] }, 'Data PRS 1_6: Orders'[MonthStart])
),
"Trend",
FORMAT(
CALCULATE(
[8_KPI Subcontractor use - Responsive Repairs (%)],
TREATAS({ 'Dates: DateTable'[MonthStart] }, 'Data PRS 1_6: Orders'[MonthStart])
),"0.0%"),
"Target", [8_KPI_T Subcontractor use - Responsive Repairs (%)],
"Tolerance", [8_KPI_LT Subcontractor use - Responsive Repairs (%)],
"Variance",
CALCULATE(
[8_KPI Subcontractor use - Responsive Repairs (%)],
TREATAS({ 'Dates: DateTable'[MonthStart] }, 'Data PRS 1_6: Orders'[MonthStart])
) - [8_KPI_T Subcontractor use - Responsive Repairs (%)],
"Status",
SWITCH(
TRUE(),
CALCULATE(
[8_KPI Subcontractor use - Responsive Repairs (%)],
TREATAS({ 'Dates: DateTable'[MonthStart] }, 'Data PRS 1_6: Orders'[MonthStart])
) > [8_KPI_LT Subcontractor use - Responsive Repairs (%)], "Behind",
CALCULATE(
[8_KPI Subcontractor use - Responsive Repairs (%)],
TREATAS({ 'Dates: DateTable'[MonthStart] }, 'Data PRS 1_6: Orders'[MonthStart])
) > [8_KPI_T Subcontractor use - Responsive Repairs (%)], "Tolerance",
"Satisfied"
),
"Difference_Label",
VAR CurrentValue2 =
CALCULATE(
[8_KPI Subcontractor use - Responsive Repairs (%)],
TREATAS({ 'Dates: DateTable'[MonthStart] }, 'Data PRS 1_6: Orders'[MonthStart])
)
VAR PrevValue2 =
CALCULATE(
[8_KPI Subcontractor use - Responsive Repairs (%)],
TREATAS({ EDATE('Dates: DateTable'[MonthStart], -1) }, 'Data PRS 1_6: Orders'[MonthStart])
)
VAR Diff2 = CurrentValue2 - PrevValue2
RETURN
IF(
ISBLANK(Diff2) || ISBLANK(PrevValue2),
BLANK(),
IF(
Diff2 > 0,
"▲ " & FORMAT(Diff2, "0.0%"),
IF(
Diff2 < 0,
"▼ " & FORMAT(ABS(Diff2), "0.0%"),
"→ 0.0%"
)
)
)
),
"KPI_Name", [KPI_Name],
"Month", [MonthStart],
"Value", [Value],
"TimeValue", "",
"Trend", [Trend],
"Target", [Target],
"Tolerance",[Tolerance],
"Variance", [Variance],
"Status", [Status],
"Difference_Label", [Difference_Label]
),
-- ─────── KPI 8.5 ───────
SELECTCOLUMNS(
ADDCOLUMNS(
FILTER(
SUMMARIZE('Dates: DateTable', 'Dates: DateTable'[MonthStart]),
'Dates: DateTable'[MonthStart] >= DATE(2025,4,1)
&& 'Dates: DateTable'[MonthStart] <= PrevMonthEnd
),
"KPI_Name", "(8.5) Subcontractor use - Major Repairs",
"Value",
CALCULATE(
[8.5_KPI Subcontractor use - Major Repairs (%)],
TREATAS({ 'Dates: DateTable'[MonthStart] }, 'Data PRS 1_6: Orders'[MonthStart])
),
"Trend",
FORMAT(
CALCULATE(
[8.5_KPI Subcontractor use - Major Repairs (%)],
TREATAS({ 'Dates: DateTable'[MonthStart] }, 'Data PRS 1_6: Orders'[MonthStart])
),"0.0%"),
"Target", [8.5_KPI_T Subcontractor use - Major Repairs (%)],
"Tolerance", [8.5_KPI_LT Subcontractor use - Major Repairs (%)],
"Variance",
CALCULATE(
[8.5_KPI Subcontractor use - Major Repairs (%)],
TREATAS({ 'Dates: DateTable'[MonthStart] }, 'Data PRS 1_6: Orders'[MonthStart])
) - [8.5_KPI_T Subcontractor use - Major Repairs (%)],
"Status",
SWITCH(
TRUE(),
CALCULATE(
[8.5_KPI Subcontractor use - Major Repairs (%)],
TREATAS({ 'Dates: DateTable'[MonthStart] }, 'Data PRS 1_6: Orders'[MonthStart])
) > [8.5_KPI_LT Subcontractor use - Major Repairs (%)], "Behind",
CALCULATE(
[8.5_KPI Subcontractor use - Major Repairs (%)],
TREATAS({ 'Dates: DateTable'[MonthStart] }, 'Data PRS 1_6: Orders'[MonthStart])
) > [8.5_KPI_T Subcontractor use - Major Repairs (%)], "Tolerance",
"Satisfied"
),
"Difference_Label",
VAR CurrentValue2 =
CALCULATE(
[8.5_KPI Subcontractor use - Major Repairs (%)],
TREATAS({ 'Dates: DateTable'[MonthStart] }, 'Data PRS 1_6: Orders'[MonthStart])
)
VAR PrevValue2 =
CALCULATE(
[8.5_KPI Subcontractor use - Major Repairs (%)],
TREATAS({ EDATE('Dates: DateTable'[MonthStart], -1) }, 'Data PRS 1_6: Orders'[MonthStart])
)
VAR Diff2 = CurrentValue2 - PrevValue2
RETURN
IF(
ISBLANK(Diff2) || ISBLANK(PrevValue2),
BLANK(),
IF(
Diff2 > 0,
"▲ " & FORMAT(Diff2, "0.0%"),
IF(
Diff2 < 0,
"▼ " & FORMAT(ABS(Diff2), "0.0%"),
"→ 0.0%"
)
)
)
),
"KPI_Name", [KPI_Name],
"Month", [MonthStart],
"Value", [Value],
"TimeValue", "",
"Trend", [Trend],
"Target", [Target],
"Tolerance",[Tolerance],
"Variance", [Variance],
"Status", [Status],
"Difference_Label", [Difference_Label]
),
-- ─────── KPI 9 ───────
SELECTCOLUMNS(
ADDCOLUMNS(
FILTER(
SUMMARIZE('Dates: DateTable', 'Dates: DateTable'[MonthStart]),
'Dates: DateTable'[MonthStart] >= DATE(2025,4,1)
&& 'Dates: DateTable'[MonthStart] <= PrevMonthEnd
),
"KPI_Name", "(9) Responsive Repairs - Fixed first time (Non-emergency)",
"Value",
CALCULATE(
[9_KPI Responsive_Repairs - Fixed first time (Non-emergency) (%)],
TREATAS({ 'Dates: DateTable'[MonthStart] }, 'Data PRS 1_6: Orders'[MonthStart])
),
"Trend",
FORMAT(
CALCULATE(
[9_KPI Responsive_Repairs - Fixed first time (Non-emergency) (%)],
TREATAS({ 'Dates: DateTable'[MonthStart] }, 'Data PRS 1_6: Orders'[MonthStart])
),"0.0%"),
"Target", [9_KPI_T Responsive_Repairs - Fixed first time (%)],
"Tolerance", [9_KPI_LT Responsive_Repairs - Fixed first time (%)],
"Variance",
CALCULATE(
[9_KPI Responsive_Repairs - Fixed first time (Non-emergency) (%)],
TREATAS({ 'Dates: DateTable'[MonthStart] }, 'Data PRS 1_6: Orders'[MonthStart])
) - [9_KPI_T Responsive_Repairs - Fixed first time (%)],
"Status",
SWITCH(
TRUE(),
CALCULATE(
[9_KPI Responsive_Repairs - Fixed first time (Non-emergency) (%)],
TREATAS({ 'Dates: DateTable'[MonthStart] }, 'Data PRS 1_6: Orders'[MonthStart])
) < [9_KPI_LT Responsive_Repairs - Fixed first time (%)], "Behind",
CALCULATE(
[9_KPI Responsive_Repairs - Fixed first time (Non-emergency) (%)],
TREATAS({ 'Dates: DateTable'[MonthStart] }, 'Data PRS 1_6: Orders'[MonthStart])
) < [9_KPI_T Responsive_Repairs - Fixed first time (%)], "Tolerance",
"Satisfied"
),
"Difference_Label",
VAR CurrentValue2 =
CALCULATE(
[9_KPI Responsive_Repairs - Fixed first time (Non-emergency) (%)],
TREATAS({ 'Dates: DateTable'[MonthStart] }, 'Data PRS 1_6: Orders'[MonthStart])
)
VAR PrevValue2 =
CALCULATE(
[9_KPI Responsive_Repairs - Fixed first time (Non-emergency) (%)],
TREATAS({ EDATE('Dates: DateTable'[MonthStart], -1) }, 'Data PRS 1_6: Orders'[MonthStart])
)
VAR Diff2 = CurrentValue2 - PrevValue2
RETURN
IF(
ISBLANK(Diff2) || ISBLANK(PrevValue2),
BLANK(),
IF(
Diff2 > 0,
"▲ " & FORMAT(Diff2, "0.0%"),
IF(
Diff2 < 0,
"▼ " & FORMAT(ABS(Diff2), "0.0%"),
"→ 0.0%"
)
)
)
),
"KPI_Name", [KPI_Name],
"Month", [MonthStart],
"Value", [Value],
"TimeValue", "",
"Trend", [Trend],
"Target", [Target],
"Tolerance",[Tolerance],
"Variance", [Variance],
"Status", [Status],
"Difference_Label", [Difference_Label]
), /*
-- ─────── KPI 9.5 ───────
SELECTCOLUMNS(
ADDCOLUMNS(
FILTER(
SUMMARIZE('Dates: DateTable', 'Dates: DateTable'[MonthStart]),
'Dates: DateTable'[MonthStart] >= DATE(2025,4,1)
&& 'Dates: DateTable'[MonthStart] <= PrevMonthEnd
),
"KPI_Name", "(9.5) Responsive Repairs - Fixed first time (TM Only - Emergency)",
"Value",
CALCULATE(
[9.5_KPI Responsive_Repairs - Fixed first time (Emergency) (%)],
TREATAS({ 'Dates: DateTable'[MonthStart] }, 'Data PRS 1_6: Orders'[MonthStart])
),
"Trend",
FORMAT(
CALCULATE(
[9.5_KPI Responsive_Repairs - Fixed first time (Emergency) (%)],
TREATAS({ 'Dates: DateTable'[MonthStart] }, 'Data PRS 1_6: Orders'[MonthStart])
),"0.0%"),
"Target", [9.5_T KPI Responsive_Repairs - Fixed first time (Emergency) (%)],
"Tolerance", [9.5_LT KPI Responsive_Repairs - Fixed first time (Emergency) (%)],
"Variance",
CALCULATE(
[9.5_KPI Responsive_Repairs - Fixed first time (Emergency) (%)],
TREATAS({ 'Dates: DateTable'[MonthStart] }, 'Data PRS 1_6: Orders'[MonthStart])
) - [9.5_T KPI Responsive_Repairs - Fixed first time (Emergency) (%)],
"Status",
SWITCH(
TRUE(),
CALCULATE(
[9.5_KPI Responsive_Repairs - Fixed first time (Emergency) (%)],
TREATAS({ 'Dates: DateTable'[MonthStart] }, 'Data PRS 1_6: Orders'[MonthStart])
) < [9.5_LT KPI Responsive_Repairs - Fixed first time (Emergency) (%)], "Behind",
CALCULATE(
[9.5_KPI Responsive_Repairs - Fixed first time (Emergency) (%)],
TREATAS({ 'Dates: DateTable'[MonthStart] }, 'Data PRS 1_6: Orders'[MonthStart])
) < [9.5_T KPI Responsive_Repairs - Fixed first time (Emergency) (%)], "Tolerance",
"Satisfied"
),
"Difference_Label",
VAR CurrentValue2 =
CALCULATE(
[9.5_KPI Responsive_Repairs - Fixed first time (Emergency) (%)],
TREATAS({ 'Dates: DateTable'[MonthStart] }, 'Data PRS 1_6: Orders'[MonthStart])
)
VAR PrevValue2 =
CALCULATE(
[9.5_KPI Responsive_Repairs - Fixed first time (Emergency) (%)],
TREATAS({ EDATE('Dates: DateTable'[MonthStart], -1) }, 'Data PRS 1_6: Orders'[MonthStart])
)
VAR Diff2 = CurrentValue2 - PrevValue2
RETURN
IF(
ISBLANK(Diff2) || ISBLANK(PrevValue2),
BLANK(),
IF(
Diff2 > 0,
"▲ " & FORMAT(Diff2, "0.0%"),
IF(
Diff2 < 0,
"▼ " & FORMAT(ABS(Diff2), "0.0%"),
"→ 0.0%"
)
)
)
),
"KPI_Name", [KPI_Name],
"Month", [MonthStart],
"Value", [Value],
"TimeValue", "",
"Trend", [Trend],
"Target", [Target],
"Tolerance",[Tolerance],
"Variance", [Variance],
"Status", [Status],
"Difference_Label", [Difference_Label]
), */
-- ─────── KPI 17 ───────
SELECTCOLUMNS(
ADDCOLUMNS(
FILTER(
SUMMARIZE('Dates: DateTable', 'Dates: DateTable'[MonthStart]),
'Dates: DateTable'[MonthStart] >= DATE(2025,4,1)
&& 'Dates: DateTable'[MonthStart] <= PrevMonthEnd
),
"KPI_Name", "(17) Major Voids completed on time",
"Value",
CALCULATE(
[17_KPI Major voids completed on time (%)],
TREATAS({ 'Dates: DateTable'[MonthStart] }, 'Data PRS 2_15: PR22'[MonthStart])
),
"Trend",
FORMAT(
CALCULATE(
[17_KPI Major voids completed on time (%)],
TREATAS({ 'Dates: DateTable'[MonthStart] }, 'Data PRS 2_15: PR22'[MonthStart])
),"0.0%"),
"Target", [17_KPI_T Major voids completed on time (%)],
"Tolerance", [17_KPI_LT Major voids completed on time (%)],
"Variance",
CALCULATE(
[17_KPI Major voids completed on time (%)],
TREATAS({ 'Dates: DateTable'[MonthStart] }, 'Data PRS 2_15: PR22'[MonthStart])
) - [17_KPI_T Major voids completed on time (%)],
"Status",
SWITCH(
TRUE(),
CALCULATE(
[17_KPI Major voids completed on time (%)],
TREATAS({ 'Dates: DateTable'[MonthStart] }, 'Data PRS 2_15: PR22'[MonthStart])
) < [17_KPI_LT Major voids completed on time (%)], "Behind",
CALCULATE(
[17_KPI Major voids completed on time (%)],
TREATAS({ 'Dates: DateTable'[MonthStart] }, 'Data PRS 2_15: PR22'[MonthStart])
) < [17_KPI_T Major voids completed on time (%)], "Tolerance",
"Satisfied"
),
"Difference_Label",
VAR CurrentValue =
CALCULATE(
[17_KPI Major voids completed on time (%)],
TREATAS({ 'Dates: DateTable'[MonthStart] }, 'Data PRS 2_15: PR22'[MonthStart])
)
VAR PrevValue =
CALCULATE(
[17_KPI Major voids completed on time (%)],
TREATAS({ EDATE('Dates: DateTable'[MonthStart], -1) }, 'Data PRS 2_15: PR22'[MonthStart])
)
VAR Diff = CurrentValue - PrevValue
RETURN
IF(
ISBLANK(Diff) || ISBLANK(PrevValue),
BLANK(),
IF(
Diff > 0, "▲ " & FORMAT(Diff, "0.0%"),
IF( Diff < 0, "▼ " & FORMAT(ABS(Diff), "0.0%"), "→ 0.0%" )
)
)
),
"KPI_Name", [KPI_Name],
"Month", [MonthStart],
"Value", [Value],
"TimeValue", "",
"Trend", [Trend],
"Target", [Target],
"Tolerance",[Tolerance],
"Variance", [Variance],
"Status", [Status],
"Difference_Label", [Difference_Label]
),
-- ─────── KPI 18 ───────
SELECTCOLUMNS(
ADDCOLUMNS(
FILTER(
SUMMARIZE('Dates: DateTable', 'Dates: DateTable'[MonthStart]),
'Dates: DateTable'[MonthStart] >= DATE(2025,4,1)
&& 'Dates: DateTable'[MonthStart] <= PrevMonthEnd
),
"KPI_Name", "(18) Average number of days to complete major voids",
"Value",
CALCULATE(
[18_KPI Average number of days to complete major void],
TREATAS({ 'Dates: DateTable'[MonthStart] }, 'Data PRS 2_15: PR22'[MonthStart])
),
"Trend",
FORMAT(
CALCULATE(
[18_KPI Average number of days to complete major void],
TREATAS({ 'Dates: DateTable'[MonthStart] }, 'Data PRS 2_15: PR22'[MonthStart])
),"0.0"),
"Target", [18_KPI_T Average number of days to complete major void],
"Tolerance", [18_KPI_LT Average number of days to complete major void],
"Variance",
CALCULATE(
[18_KPI Average number of days to complete major void],
TREATAS({ 'Dates: DateTable'[MonthStart] }, 'Data PRS 2_15: PR22'[MonthStart])
) - [18_KPI_T Average number of days to complete major void],
"Status",
SWITCH(
TRUE(),
CALCULATE(
[18_KPI Average number of days to complete major void],
TREATAS({ 'Dates: DateTable'[MonthStart] }, 'Data PRS 2_15: PR22'[MonthStart])
) > [18_KPI_LT Average number of days to complete major void], "Behind",
CALCULATE(
[18_KPI Average number of days to complete major void],
TREATAS({ 'Dates: DateTable'[MonthStart] }, 'Data PRS 2_15: PR22'[MonthStart])
) > [18_KPI_T Average number of days to complete major void], "Tolerance",
"Satisfied"
),
"Difference_Label",
VAR CurrentValue =
CALCULATE(
[18_KPI Average number of days to complete major void],
TREATAS({ 'Dates: DateTable'[MonthStart] }, 'Data PRS 2_15: PR22'[MonthStart])
)
VAR PrevValue =
CALCULATE(
[18_KPI Average number of days to complete major void],
TREATAS({ EDATE('Dates: DateTable'[MonthStart], -1) }, 'Data PRS 2_15: PR22'[MonthStart])
)
VAR Diff = CurrentValue - PrevValue
RETURN
IF(
ISBLANK(Diff) || ISBLANK(PrevValue),
BLANK(),
IF(
Diff > 0, "▲ " & FORMAT(Diff, "0.0"),
IF( Diff < 0, "▼ " & FORMAT(ABS(Diff), "0.0"), "→ 0.0" )
)
)
),
"KPI_Name", [KPI_Name],
"Month", [MonthStart],
"Value", [Value],
"TimeValue", "",
"Trend", [Trend],
"Target", [Target],
"Tolerance",[Tolerance],
"Variance", [Variance],
"Status", [Status],
"Difference_Label", [Difference_Label]
),
-- ─────── KPI 19 ───────
SELECTCOLUMNS(
ADDCOLUMNS(
FILTER(
SUMMARIZE('Dates: DateTable', 'Dates: DateTable'[MonthStart]),
'Dates: DateTable'[MonthStart] >= DATE(2025,4,1)
&& 'Dates: DateTable'[MonthStart] <= PrevMonthEnd
),
"KPI_Name", "(19) Average number of days to complete minor voids",
"Value",
CALCULATE(
[19_KPI Average number of days to complete minor void],
TREATAS({ 'Dates: DateTable'[MonthStart] }, 'Data PRS 2_15: PR22'[MonthStart])
),
"Trend",
FORMAT(
CALCULATE(
[19_KPI Average number of days to complete minor void],
TREATAS({ 'Dates: DateTable'[MonthStart] }, 'Data PRS 2_15: PR22'[MonthStart])
),"0.0"),
"Target", [19_KPI_T Average number of days to complete minor void],
"Tolerance", [19_KPI_LT Average number of days to complete minor void],
"Variance",
CALCULATE(
[19_KPI Average number of days to complete minor void],
TREATAS({ 'Dates: DateTable'[MonthStart] }, 'Data PRS 2_15: PR22'[MonthStart])
) - [19_KPI_T Average number of days to complete minor void],
"Status",
VAR KPI_Value =
CALCULATE(
[19_KPI Average number of days to complete minor void],
TREATAS({ 'Dates: DateTable'[MonthStart] }, 'Data PRS 2_15: PR22'[MonthStart])
)
RETURN
SWITCH(
TRUE(),
ISBLANK(KPI_Value), "No Data",
KPI_Value > [19_KPI_LT Average number of days to complete minor void], "Behind",
KPI_Value > [19_KPI_T Average number of days to complete minor void], "Tolerance",
"Satisfied"
),
"Difference_Label",
VAR CurrentValue =
CALCULATE(
[19_KPI Average number of days to complete minor void],
TREATAS({ 'Dates: DateTable'[MonthStart] }, 'Data PRS 2_15: PR22'[MonthStart])
)
VAR PrevValue =
CALCULATE(
[19_KPI Average number of days to complete minor void],
TREATAS({ EDATE('Dates: DateTable'[MonthStart], -1) }, 'Data PRS 2_15: PR22'[MonthStart])
)
VAR Diff = CurrentValue - PrevValue
RETURN
IF(
ISBLANK(Diff) || ISBLANK(PrevValue),
BLANK(),
IF(
Diff > 0, "▲ " & FORMAT(Diff, "0.0"),
IF( Diff < 0, "▼ " & FORMAT(ABS(Diff), "0.0"), "→ 0.0" )
)
)
),
"KPI_Name", [KPI_Name],
"Month", [MonthStart],
"Value", [Value],
"TimeValue", "",
"Trend", [Trend],
"Target", [Target],
"Tolerance",[Tolerance],
"Variance", [Variance],
"Status", [Status],
"Difference_Label", [Difference_Label]
),
-- ─────── KPI 20 ───────
SELECTCOLUMNS(
ADDCOLUMNS(
FILTER(
SUMMARIZE('Dates: DateTable', 'Dates: DateTable'[MonthStart]),
'Dates: DateTable'[MonthStart] >= DATE(2025,4,1)
&& 'Dates: DateTable'[MonthStart] <= PrevMonthEnd
),
"KPI_Name", "(20) Average number of days to complete standard voids",
"Value",
CALCULATE(
[20_KPI Average number of days to complete Standard void],
TREATAS({ 'Dates: DateTable'[MonthStart] }, 'Data PRS 2_15: PR22'[MonthStart])
),
"Trend",
FORMAT(
CALCULATE(
[20_KPI Average number of days to complete Standard void],
TREATAS({ 'Dates: DateTable'[MonthStart] }, 'Data PRS 2_15: PR22'[MonthStart])
),"0.0"),
"Target", [20_KPI_T Average number of days to complete Standard void],
"Tolerance", [20_KPI_LT Average number of days to complete Standard void],
"Variance",
CALCULATE(
[20_KPI Average number of days to complete Standard void],
TREATAS({ 'Dates: DateTable'[MonthStart] }, 'Data PRS 2_15: PR22'[MonthStart])
) - [20_KPI_T Average number of days to complete Standard void],
"Status",
SWITCH(
TRUE(),
CALCULATE(
[20_KPI Average number of days to complete Standard void],
TREATAS({ 'Dates: DateTable'[MonthStart] }, 'Data PRS 2_15: PR22'[MonthStart])
) > [20_KPI_LT Average number of days to complete Standard void], "Behind",
CALCULATE(
[20_KPI Average number of days to complete Standard void],
TREATAS({ 'Dates: DateTable'[MonthStart] }, 'Data PRS 2_15: PR22'[MonthStart])
) > [20_KPI_T Average number of days to complete Standard void], "Tolerance",
"Satisfied"
),
"Difference_Label",
VAR CurrentValue =
CALCULATE(
[20_KPI Average number of days to complete Standard void],
TREATAS({ 'Dates: DateTable'[MonthStart] }, 'Data PRS 2_15: PR22'[MonthStart])
)
VAR PrevValue =
CALCULATE(
[20_KPI Average number of days to complete Standard void],
TREATAS({ EDATE('Dates: DateTable'[MonthStart], -1) }, 'Data PRS 2_15: PR22'[MonthStart])
)
VAR Diff = CurrentValue - PrevValue
RETURN
IF(
ISBLANK(Diff) || ISBLANK(PrevValue),
BLANK(),
IF(
Diff > 0, "▲ " & FORMAT(Diff, "0.0"),
IF( Diff < 0, "▼ " & FORMAT(ABS(Diff), "0.0"), "→ 0.0" )
)
)
),
"KPI_Name", [KPI_Name],
"Month", [MonthStart],
"Value", [Value],
"TimeValue", "",
"Trend", [Trend],
"Target", [Target],
"Tolerance",[Tolerance],
"Variance", [Variance],
"Status", [Status],
"Difference_Label", [Difference_Label]
),
-- ─────── KPI 24 ───────
SELECTCOLUMNS(
ADDCOLUMNS(
FILTER(
SUMMARIZE('Dates: DateTable', 'Dates: DateTable'[MonthStart]),
'Dates: DateTable'[MonthStart] >= DATE(2025,4,1)
&& 'Dates: DateTable'[MonthStart] <= PrevMonthEnd
),
"KPI_Name", "(24) Standard voids completed on time",
"Value",
CALCULATE(
[24_KPI Standard voids completed on time (%)],
TREATAS({ 'Dates: DateTable'[MonthStart] }, 'Data PRS 2_15: PR22'[MonthStart])
),
"Trend",
FORMAT(
CALCULATE(
[24_KPI Standard voids completed on time (%)],
TREATAS({ 'Dates: DateTable'[MonthStart] }, 'Data PRS 2_15: PR22'[MonthStart])
),"0.0%"),
"Target", [24_KPI_T Standard voids completed on time (%)],
"Tolerance", [24_KPI_LT Standard voids completed on time (%)],
"Variance",
CALCULATE(
[24_KPI Standard voids completed on time (%)],
TREATAS({ 'Dates: DateTable'[MonthStart] }, 'Data PRS 2_15: PR22'[MonthStart])
) - [24_KPI_T Standard voids completed on time (%)],
"Status",
SWITCH(
TRUE(),
CALCULATE(
[24_KPI Standard voids completed on time (%)],
TREATAS({ 'Dates: DateTable'[MonthStart] }, 'Data PRS 2_15: PR22'[MonthStart])
) < [24_KPI_LT Standard voids completed on time (%)], "Behind",
CALCULATE(
[24_KPI Standard voids completed on time (%)],
TREATAS({ 'Dates: DateTable'[MonthStart] }, 'Data PRS 2_15: PR22'[MonthStart])
) < [24_KPI_T Standard voids completed on time (%)], "Tolerance",
"Satisfied"
),
"Difference_Label",
VAR CurrentValue =
CALCULATE(
[24_KPI Standard voids completed on time (%)],
TREATAS({ 'Dates: DateTable'[MonthStart] }, 'Data PRS 2_15: PR22'[MonthStart])
)
VAR PrevValue =
CALCULATE(
[24_KPI Standard voids completed on time (%)],
TREATAS({ EDATE('Dates: DateTable'[MonthStart], -1) }, 'Data PRS 2_15: PR22'[MonthStart])
)
VAR Diff = CurrentValue - PrevValue
RETURN
IF(
ISBLANK(Diff) || ISBLANK(PrevValue),
BLANK(),
IF(
Diff > 0, "▲ " & FORMAT(Diff, "0.0%"),
IF( Diff < 0, "▼ " & FORMAT(ABS(Diff), "0.0%"), "→ 0.0%" )
)
)
),
"KPI_Name", [KPI_Name],
"Month", [MonthStart],
"Value", [Value],
"TimeValue", "",
"Trend", [Trend],
"Target", [Target],
"Tolerance",[Tolerance],
"Variance", [Variance],
"Status", [Status],
"Difference_Label", [Difference_Label]
),
-- ─────── KPI 26V ───────
SELECTCOLUMNS(
ADDCOLUMNS(
FILTER(
SUMMARIZE('Dates: DateTable', 'Dates: DateTable'[MonthStart]),
'Dates: DateTable'[MonthStart] >= DATE(2025,4,1)
&& 'Dates: DateTable'[MonthStart] <= PrevMonthEnd
),
"KPI_Name", "(26V) Significant voids completed on time",
"Value",
CALCULATE(
[26V_KPI Significant voids completed on time (%)],
TREATAS({ 'Dates: DateTable'[MonthStart] }, 'Data PRS 2_15: PR22'[MonthStart])
),
"Trend",
FORMAT(
CALCULATE(
[26V_KPI Significant voids completed on time (%)],
TREATAS({ 'Dates: DateTable'[MonthStart] }, 'Data PRS 2_15: PR22'[MonthStart])
),"0.0%"),
"Target", [26V_KPI_T Significant voids completed on time (%)],
"Tolerance", [26V_KPI_LT Significant voids completed on time (%)],
"Variance",
CALCULATE(
[26V_KPI Significant voids completed on time (%)],
TREATAS({ 'Dates: DateTable'[MonthStart] }, 'Data PRS 2_15: PR22'[MonthStart])
) - [26V_KPI_T Significant voids completed on time (%)],
"Status",
VAR KPI_Value =
CALCULATE(
[26V_KPI Significant voids completed on time (%)],
TREATAS({ 'Dates: DateTable'[MonthStart] }, 'Data PRS 2_15: PR22'[MonthStart])
)
RETURN
SWITCH(
TRUE(),
ISBLANK(KPI_Value), "No Data",
KPI_Value < [26V_KPI_LT Significant voids completed on time (%)], "Behind",
KPI_Value < [26V_KPI_T Significant voids completed on time (%)], "Tolerance",
"Satisfied"
),
"Difference_Label",
VAR CurrentValue =
CALCULATE(
[26V_KPI Significant voids completed on time (%)],
TREATAS({ 'Dates: DateTable'[MonthStart] }, 'Data PRS 2_15: PR22'[MonthStart])
)
VAR PrevValue =
CALCULATE(
[26V_KPI Significant voids completed on time (%)],
TREATAS({ EDATE('Dates: DateTable'[MonthStart], -1) }, 'Data PRS 2_15: PR22'[MonthStart])
)
VAR Diff = CurrentValue - PrevValue
RETURN
IF(
ISBLANK(Diff) || ISBLANK(PrevValue),
BLANK(),
IF(
Diff > 0, "▲ " & FORMAT(Diff, "0.0%"),
IF( Diff < 0, "▼ " & FORMAT(ABS(Diff), "0.0%"), "→ 0.0%" )
)
)
),
"KPI_Name", [KPI_Name],
"Month", [MonthStart],
"Value", [Value],
"TimeValue", "",
"Trend", [Trend],
"Target", [Target],
"Tolerance",[Tolerance],
"Variance", [Variance],
"Status", [Status],
"Difference_Label", [Difference_Label]
),
-- ─────── KPI 27V ───────
SELECTCOLUMNS(
ADDCOLUMNS(
FILTER(
SUMMARIZE('Dates: DateTable', 'Dates: DateTable'[MonthStart]),
'Dates: DateTable'[MonthStart] >= DATE(2025,4,1)
&& 'Dates: DateTable'[MonthStart] <= PrevMonthEnd
),
"KPI_Name", "(27V) Average number of days to complete a significant void",
"Value",
CALCULATE(
[27V_KPI Average number of days to complete a significant void],
TREATAS({ 'Dates: DateTable'[MonthStart] }, 'Data PRS 2_15: PR22'[MonthStart])
),
"Trend",
FORMAT(
CALCULATE(
[27V_KPI Average number of days to complete a significant void],
TREATAS({ 'Dates: DateTable'[MonthStart] }, 'Data PRS 2_15: PR22'[MonthStart])
),"0.0"),
"Target", [27V_KPI_T Average number of days to complete a significant void],
"Tolerance", [27V_KPI_LT Average number of days to complete a significant void],
"Variance",
CALCULATE(
[27V_KPI Average number of days to complete a significant void],
TREATAS({ 'Dates: DateTable'[MonthStart] }, 'Data PRS 2_15: PR22'[MonthStart])
) - [27V_KPI_T Average number of days to complete a significant void],
"Status",
VAR KPI_Value =
CALCULATE(
[27V_KPI Average number of days to complete a significant void],
TREATAS({ 'Dates: DateTable'[MonthStart] }, 'Data PRS 2_15: PR22'[MonthStart])
)
RETURN
SWITCH(
TRUE(),
ISBLANK(KPI_Value), "No Data",
KPI_Value > [27V_KPI_LT Average number of days to complete a significant void], "Behind",
KPI_Value > [27V_KPI_T Average number of days to complete a significant void], "Tolerance",
"Satisfied"
),
"Difference_Label",
VAR CurrentValue =
CALCULATE(
[27V_KPI Average number of days to complete a significant void],
TREATAS({ 'Dates: DateTable'[MonthStart] }, 'Data PRS 2_15: PR22'[MonthStart])
)
VAR PrevValue =
CALCULATE(
[27V_KPI Average number of days to complete a significant void],
TREATAS({ EDATE('Dates: DateTable'[MonthStart], -1) }, 'Data PRS 2_15: PR22'[MonthStart])
)
VAR Diff = CurrentValue - PrevValue
RETURN
IF(
ISBLANK(Diff) || ISBLANK(PrevValue),
BLANK(),
IF(
Diff > 0, "▲ " & FORMAT(Diff, "0.0"),
IF( Diff < 0, "▼ " & FORMAT(ABS(Diff), "0.0"), "→ 0.0" )
)
)
),
"KPI_Name", [KPI_Name],
"Month", [MonthStart],
"Value", [Value],
"TimeValue", "",
"Trend", [Trend],
"Target", [Target],
"Tolerance",[Tolerance],
"Variance", [Variance],
"Status", [Status],
"Difference_Label", [Difference_Label]
),
-- ─────── KPI 15PN ───────
SELECTCOLUMNS(
ADDCOLUMNS(
FILTER(
SUMMARIZE('Dates: DateTable', 'Dates: DateTable'[MonthStart]),
'Dates: DateTable'[MonthStart] >= DATE(2025,4,1)
&& 'Dates: DateTable'[MonthStart] <= PrevMonthEnd
),
"KPI_Name", "(15PN) D&M inspections carried out within target timescales",
"Value",
CALCULATE(
[15PN_KPI: Damp and Mould inspections carried out within target timescales (%)],
TREATAS({ 'Dates: DateTable'[MonthStart] }, 'Data PRS: Orders + Visits'[MonthStart (ActualStart)])
),
"Trend",
FORMAT(
CALCULATE(
[15PN_KPI: Damp and Mould inspections carried out within target timescales (%)],
TREATAS({ 'Dates: DateTable'[MonthStart] }, 'Data PRS: Orders + Visits'[MonthStart (ActualStart)])
),"0.0%"),
"Target", [15PN_T KPI:Damp and Mould inspections carried out within target timescales (%)],
"Tolerance", [15PN_LT KPI:Damp and Mould inspections carried out within target timescales (%)],
"Variance",
CALCULATE(
[15PN_KPI: Damp and Mould inspections carried out within target timescales (%)],
TREATAS({ 'Dates: DateTable'[MonthStart] }, 'Data PRS: Orders + Visits'[MonthStart (ActualStart)])
) - [15PN_T KPI:Damp and Mould inspections carried out within target timescales (%)],
"Status",
SWITCH(
TRUE(),
CALCULATE(
[15PN_KPI: Damp and Mould inspections carried out within target timescales (%)],
TREATAS({ 'Dates: DateTable'[MonthStart] }, 'Data PRS: Orders + Visits'[MonthStart (ActualStart)])
) < [15PN_LT KPI:Damp and Mould inspections carried out within target timescales (%)], "Behind",
CALCULATE(
[15PN_KPI: Damp and Mould inspections carried out within target timescales (%)],
TREATAS({ 'Dates: DateTable'[MonthStart] }, 'Data PRS: Orders + Visits'[MonthStart (ActualStart)])
) < [15PN_T KPI:Damp and Mould inspections carried out within target timescales (%)], "Tolerance",
"Satisfied"
),
"Difference_Label",
VAR CurrentValue2 =
CALCULATE(
[15PN_KPI: Damp and Mould inspections carried out within target timescales (%)],
TREATAS({ 'Dates: DateTable'[MonthStart] }, 'Data PRS: Orders + Visits'[MonthStart (ActualStart)])
)
VAR PrevValue2 =
CALCULATE(
[15PN_KPI: Damp and Mould inspections carried out within target timescales (%)],
TREATAS({ EDATE('Dates: DateTable'[MonthStart], -1) }, 'Data PRS: Orders + Visits'[MonthStart (ActualStart)])
)
VAR Diff2 = CurrentValue2 - PrevValue2
RETURN
IF(
ISBLANK(Diff2) || ISBLANK(PrevValue2),
BLANK(),
IF(
Diff2 > 0,
"▲ " & FORMAT(Diff2, "0.0%"),
IF(
Diff2 < 0,
"▼ " & FORMAT(ABS(Diff2), "0.0%"),
"→ 0.0%"
)
)
)
),
"KPI_Name", [KPI_Name],
"Month", [MonthStart],
"Value", [Value],
"TimeValue", "",
"Trend", [Trend],
"Target", [Target],
"Tolerance",[Tolerance],
"Variance", [Variance],
"Status", [Status],
"Difference_Label", [Difference_Label]
),
-- ─────── KPI 16PN ───────
SELECTCOLUMNS(
ADDCOLUMNS(
FILTER(
SUMMARIZE('Dates: DateTable', 'Dates: DateTable'[MonthStart]),
'Dates: DateTable'[MonthStart] >= DATE(2025,4,1)
&& 'Dates: DateTable'[MonthStart] <= PrevMonthEnd
),
"KPI_Name", "(16PN) D&M Remedial work carried out within target timescales",
"Value",
CALCULATE(
[16PN_KPI: Damp and Mould Remedial work carried out within target timescales (%)],
TREATAS({ 'Dates: DateTable'[MonthStart] }, 'Data PRS 1_6: Orders'[MonthStart])
),
"Trend",
FORMAT(
CALCULATE(
[16PN_KPI: Damp and Mould Remedial work carried out within target timescales (%)],
TREATAS({ 'Dates: DateTable'[MonthStart] }, 'Data PRS 1_6: Orders'[MonthStart])
),"0.0%"),
"Target", [16PN_T KPI: Damp and Mould Remedial work carried out within target timescales (%)],
"Tolerance", [16PN_LT KPI: Damp and Mould Remedial work carried out within target timescales (%)],
"Variance",
CALCULATE(
[16PN_KPI: Damp and Mould Remedial work carried out within target timescales (%)],
TREATAS({ 'Dates: DateTable'[MonthStart] }, 'Data PRS 1_6: Orders'[MonthStart])
) - [16PN_T KPI: Damp and Mould Remedial work carried out within target timescales (%)],
"Status",
SWITCH(
TRUE(),
CALCULATE(
[16PN_KPI: Damp and Mould Remedial work carried out within target timescales (%)],
TREATAS({ 'Dates: DateTable'[MonthStart] }, 'Data PRS 1_6: Orders'[MonthStart])
) < [16PN_LT KPI: Damp and Mould Remedial work carried out within target timescales (%)], "Behind",
CALCULATE(
[16PN_KPI: Damp and Mould Remedial work carried out within target timescales (%)],
TREATAS({ 'Dates: DateTable'[MonthStart] }, 'Data PRS 1_6: Orders'[MonthStart])
) < [16PN_T KPI: Damp and Mould Remedial work carried out within target timescales (%)], "Tolerance",
"Satisfied"
),
"Difference_Label",
VAR CurrentValue2 =
CALCULATE(
[16PN_KPI: Damp and Mould Remedial work carried out within target timescales (%)],
TREATAS({ 'Dates: DateTable'[MonthStart] }, 'Data PRS 1_6: Orders'[MonthStart])
)
VAR PrevValue2 =
CALCULATE(
[16PN_KPI: Damp and Mould Remedial work carried out within target timescales (%)],
TREATAS({ EDATE('Dates: DateTable'[MonthStart], -1) }, 'Data PRS 1_6: Orders'[MonthStart])
)
VAR Diff2 = CurrentValue2 - PrevValue2
RETURN
IF(
ISBLANK(Diff2) || ISBLANK(PrevValue2),
BLANK(),
IF(
Diff2 > 0,
"▲ " & FORMAT(Diff2, "0.0%"),
IF(
Diff2 < 0,
"▼ " & FORMAT(ABS(Diff2), "0.0%"),
"→ 0.0%"
)
)
)
),
"KPI_Name", [KPI_Name],
"Month", [MonthStart],
"Value", [Value],
"TimeValue", "",
"Trend", [Trend],
"Target", [Target],
"Tolerance",[Tolerance],
"Variance", [Variance],
"Status", [Status],
"Difference_Label", [Difference_Label]
),
-- ─────── KPI 29 ───────
SELECTCOLUMNS(
ADDCOLUMNS(
FILTER(
SUMMARIZE('Dates: DateTable', 'Dates: DateTable'[MonthStart]),
'Dates: DateTable'[MonthStart] >= DATE(2025,4,1)
&& 'Dates: DateTable'[MonthStart] <= PrevMonthEnd
),
"KPI_Name", "(16) Minor Voids completed on time",
"Value",
CALCULATE(
[16_KPI Minor voids completed on time (%)],
TREATAS({ 'Dates: DateTable'[MonthStart] }, 'Data PRS 2_15: PR22'[MonthStart])
),
"Trend",
FORMAT(
CALCULATE(
[16_KPI Minor voids completed on time (%)],
TREATAS({ 'Dates: DateTable'[MonthStart] }, 'Data PRS 2_15: PR22'[MonthStart])
),"0.0%"),
"Target", [16_KPI_T Minor voids completed on time (%)],
"Tolerance", [16_KPI_LT Minor voids completed on time (%)],
"Variance",
CALCULATE(
[16_KPI Minor voids completed on time (%)],
TREATAS({ 'Dates: DateTable'[MonthStart] }, 'Data PRS 2_15: PR22'[MonthStart])
) - [16_KPI_T Minor voids completed on time (%)],
"Status",
VAR KPI_Value =
CALCULATE(
[16_KPI Minor voids completed on time (%)],
TREATAS({ 'Dates: DateTable'[MonthStart] }, 'Data PRS 2_15: PR22'[MonthStart])
)
RETURN
SWITCH(
TRUE(),
ISBLANK(KPI_Value), "No Data",
KPI_Value < [16_KPI_LT Minor voids completed on time (%)], "Behind",
KPI_Value < [16_KPI_T Minor voids completed on time (%)], "Tolerance",
"Satisfied"
),
"Difference_Label",
VAR CurrentValue =
CALCULATE(
[16_KPI Minor voids completed on time (%)],
TREATAS({ 'Dates: DateTable'[MonthStart] }, 'Data PRS 2_15: PR22'[MonthStart])
)
VAR PrevValue =
CALCULATE(
[16_KPI Minor voids completed on time (%)],
TREATAS({ EDATE('Dates: DateTable'[MonthStart], -1) }, 'Data PRS 2_15: PR22'[MonthStart])
)
VAR Diff = CurrentValue - PrevValue
RETURN
IF(
ISBLANK(Diff) || ISBLANK(PrevValue),
BLANK(),
IF(
Diff > 0, "▲ " & FORMAT(Diff, "0.0%"),
IF( Diff < 0, "▼ " & FORMAT(ABS(Diff), "0.0%"), "→ 0.0%" )
)
)
),
"KPI_Name", [KPI_Name],
"Month", [MonthStart],
"Value", [Value],
"TimeValue", "",
"Trend", [Trend],
"Target", [Target],
"Tolerance",[Tolerance],
"Variance", [Variance],
"Status", [Status],
"Difference_Label", [Difference_Label]
),
-- ─────── KPI 17 ───────
SELECTCOLUMNS(
ADDCOLUMNS(
FILTER(
SUMMARIZE('Dates: DateTable', 'Dates: DateTable'[MonthStart]),
'Dates: DateTable'[MonthStart] >= DATE(2025,4,1)
&& 'Dates: DateTable'[MonthStart] <= PrevMonthEnd
),
"KPI_Name", "(17) Major Voids completed on time",
"Value",
CALCULATE(
[17_KPI Major voids completed on time (%)],
TREATAS({ 'Dates: DateTable'[MonthStart] }, 'Data PRS 2_15: PR22'[MonthStart])
),
"Trend",
FORMAT(
CALCULATE(
[17_KPI Major voids completed on time (%)],
TREATAS({ 'Dates: DateTable'[MonthStart] }, 'Data PRS 2_15: PR22'[MonthStart])
),"0.0%"),
"Target", [17_KPI_T Major voids completed on time (%)],
"Tolerance", [17_KPI_LT Major voids completed on time (%)],
"Variance",
CALCULATE(
[17_KPI Major voids completed on time (%)],
TREATAS({ 'Dates: DateTable'[MonthStart] }, 'Data PRS 2_15: PR22'[MonthStart])
) - [17_KPI_T Major voids completed on time (%)],
"Status",
SWITCH(
TRUE(),
CALCULATE(
[17_KPI Major voids completed on time (%)],
TREATAS({ 'Dates: DateTable'[MonthStart] }, 'Data PRS 2_15: PR22'[MonthStart])
) < [17_KPI_LT Major voids completed on time (%)], "Behind",
CALCULATE(
[17_KPI Major voids completed on time (%)],
TREATAS({ 'Dates: DateTable'[MonthStart] }, 'Data PRS 2_15: PR22'[MonthStart])
) < [17_KPI_T Major voids completed on time (%)], "Tolerance",
"Satisfied"
),
"Difference_Label",
VAR CurrentValue =
CALCULATE(
[17_KPI Major voids completed on time (%)],
TREATAS({ 'Dates: DateTable'[MonthStart] }, 'Data PRS 2_15: PR22'[MonthStart])
)
VAR PrevValue =
CALCULATE(
[17_KPI Major voids completed on time (%)],
TREATAS({ EDATE('Dates: DateTable'[MonthStart], -1) }, 'Data PRS 2_15: PR22'[MonthStart])
)
VAR Diff = CurrentValue - PrevValue
RETURN
IF(
ISBLANK(Diff) || ISBLANK(PrevValue),
BLANK(),
IF(
Diff > 0, "▲ " & FORMAT(Diff, "0.0%"),
IF( Diff < 0, "▼ " & FORMAT(ABS(Diff), "0.0%"), "→ 0.0%" )
)
)
),
"KPI_Name", [KPI_Name],
"Month", [MonthStart],
"Value", [Value],
"TimeValue", "",
"Trend", [Trend],
"Target", [Target],
"Tolerance",[Tolerance],
"Variance", [Variance],
"Status", [Status],
"Difference_Label", [Difference_Label]
),
-- ─────── KPI 18 ───────
SELECTCOLUMNS(
ADDCOLUMNS(
FILTER(
SUMMARIZE('Dates: DateTable', 'Dates: DateTable'[MonthStart]),
'Dates: DateTable'[MonthStart] >= DATE(2025,4,1)
&& 'Dates: DateTable'[MonthStart] <= PrevMonthEnd
),
"KPI_Name", "(18) Average number of days to complete major voids",
"Value",
CALCULATE(
[18_KPI Average number of days to complete major void],
TREATAS({ 'Dates: DateTable'[MonthStart] }, 'Data PRS 2_15: PR22'[MonthStart])
),
"Trend",
FORMAT(
CALCULATE(
[18_KPI Average number of days to complete major void],
TREATAS({ 'Dates: DateTable'[MonthStart] }, 'Data PRS 2_15: PR22'[MonthStart])
),"0.0"),
"Target", [18_KPI_T Average number of days to complete major void],
"Tolerance", [18_KPI_LT Average number of days to complete major void],
"Variance",
CALCULATE(
[18_KPI Average number of days to complete major void],
TREATAS({ 'Dates: DateTable'[MonthStart] }, 'Data PRS 2_15: PR22'[MonthStart])
) - [18_KPI_T Average number of days to complete major void],
"Status",
SWITCH(
TRUE(),
CALCULATE(
[18_KPI Average number of days to complete major void],
TREATAS({ 'Dates: DateTable'[MonthStart] }, 'Data PRS 2_15: PR22'[MonthStart])
) > [18_KPI_LT Average number of days to complete major void], "Behind",
CALCULATE(
[18_KPI Average number of days to complete major void],
TREATAS({ 'Dates: DateTable'[MonthStart] }, 'Data PRS 2_15: PR22'[MonthStart])
) > [18_KPI_T Average number of days to complete major void], "Tolerance",
"Satisfied"
),
"Difference_Label",
VAR CurrentValue =
CALCULATE(
[18_KPI Average number of days to complete major void],
TREATAS({ 'Dates: DateTable'[MonthStart] }, 'Data PRS 2_15: PR22'[MonthStart])
)
VAR PrevValue =
CALCULATE(
[18_KPI Average number of days to complete major void],
TREATAS({ EDATE('Dates: DateTable'[MonthStart], -1) }, 'Data PRS 2_15: PR22'[MonthStart])
)
VAR Diff = CurrentValue - PrevValue
RETURN
IF(
ISBLANK(Diff) || ISBLANK(PrevValue),
BLANK(),
IF(
Diff > 0, "▲ " & FORMAT(Diff, "0.0"),
IF( Diff < 0, "▼ " & FORMAT(ABS(Diff), "0.0"), "→ 0.0" )
)
)
),
"KPI_Name", [KPI_Name],
"Month", [MonthStart],
"Value", [Value],
"TimeValue", "",
"Trend", [Trend],
"Target", [Target],
"Tolerance",[Tolerance],
"Variance", [Variance],
"Status", [Status],
"Difference_Label", [Difference_Label]
),
-- ─────── KPI 20 ───────
SELECTCOLUMNS(
ADDCOLUMNS(
FILTER(
SUMMARIZE('Dates: DateTable', 'Dates: DateTable'[MonthStart]),
'Dates: DateTable'[MonthStart] >= DATE(2025,4,1)
&& 'Dates: DateTable'[MonthStart] <= PrevMonthEnd
),
"KPI_Name", "(20) Average number of days to complete standard voids",
"Value",
CALCULATE(
[20_KPI Average number of days to complete Standard void],
TREATAS({ 'Dates: DateTable'[MonthStart] }, 'Data PRS 2_15: PR22'[MonthStart])
),
"Trend",
FORMAT(
CALCULATE(
[20_KPI Average number of days to complete Standard void],
TREATAS({ 'Dates: DateTable'[MonthStart] }, 'Data PRS 2_15: PR22'[MonthStart])
),"0.0"),
"Target", [20_KPI_T Average number of days to complete Standard void],
"Tolerance", [20_KPI_LT Average number of days to complete Standard void],
"Variance",
CALCULATE(
[20_KPI Average number of days to complete Standard void],
TREATAS({ 'Dates: DateTable'[MonthStart] }, 'Data PRS 2_15: PR22'[MonthStart])
) - [20_KPI_T Average number of days to complete Standard void],
"Status",
SWITCH(
TRUE(),
CALCULATE(
[20_KPI Average number of days to complete Standard void],
TREATAS({ 'Dates: DateTable'[MonthStart] }, 'Data PRS 2_15: PR22'[MonthStart])
) > [20_KPI_LT Average number of days to complete Standard void], "Behind",
CALCULATE(
[20_KPI Average number of days to complete Standard void],
TREATAS({ 'Dates: DateTable'[MonthStart] }, 'Data PRS 2_15: PR22'[MonthStart])
) > [20_KPI_T Average number of days to complete Standard void], "Tolerance",
"Satisfied"
),
"Difference_Label",
VAR CurrentValue =
CALCULATE(
[20_KPI Average number of days to complete Standard void],
TREATAS({ 'Dates: DateTable'[MonthStart] }, 'Data PRS 2_15: PR22'[MonthStart])
)
VAR PrevValue =
CALCULATE(
[20_KPI Average number of days to complete Standard void],
TREATAS({ EDATE('Dates: DateTable'[MonthStart], -1) }, 'Data PRS 2_15: PR22'[MonthStart])
)
VAR Diff = CurrentValue - PrevValue
RETURN
IF(
ISBLANK(Diff) || ISBLANK(PrevValue),
BLANK(),
IF(
Diff > 0, "▲ " & FORMAT(Diff, "0.0"),
IF( Diff < 0, "▼ " & FORMAT(ABS(Diff), "0.0"), "→ 0.0" )
)
)
),
"KPI_Name", [KPI_Name],
"Month", [MonthStart],
"Value", [Value],
"TimeValue", "",
"Trend", [Trend],
"Target", [Target],
"Tolerance",[Tolerance],
"Variance", [Variance],
"Status", [Status],
"Difference_Label", [Difference_Label]
),
-- ─────── KPI 24 ───────
SELECTCOLUMNS(
ADDCOLUMNS(
FILTER(
SUMMARIZE('Dates: DateTable', 'Dates: DateTable'[MonthStart]),
'Dates: DateTable'[MonthStart] >= DATE(2025,4,1)
&& 'Dates: DateTable'[MonthStart] <= PrevMonthEnd
),
"KPI_Name", "(24) Standard voids completed on time",
"Value",
CALCULATE(
[24_KPI Standard voids completed on time (%)],
TREATAS({ 'Dates: DateTable'[MonthStart] }, 'Data PRS 2_15: PR22'[MonthStart])
),
"Trend",
FORMAT(
CALCULATE(
[24_KPI Standard voids completed on time (%)],
TREATAS({ 'Dates: DateTable'[MonthStart] }, 'Data PRS 2_15: PR22'[MonthStart])
),"0.0%"),
"Target", [24_KPI_T Standard voids completed on time (%)],
"Tolerance", [24_KPI_LT Standard voids completed on time (%)],
"Variance",
CALCULATE(
[24_KPI Standard voids completed on time (%)],
TREATAS({ 'Dates: DateTable'[MonthStart] }, 'Data PRS 2_15: PR22'[MonthStart])
) - [24_KPI_T Standard voids completed on time (%)],
"Status",
SWITCH(
TRUE(),
CALCULATE(
[24_KPI Standard voids completed on time (%)],
TREATAS({ 'Dates: DateTable'[MonthStart] }, 'Data PRS 2_15: PR22'[MonthStart])
) < [24_KPI_LT Standard voids completed on time (%)], "Behind",
CALCULATE(
[24_KPI Standard voids completed on time (%)],
TREATAS({ 'Dates: DateTable'[MonthStart] }, 'Data PRS 2_15: PR22'[MonthStart])
) < [24_KPI_T Standard voids completed on time (%)], "Tolerance",
"Satisfied"
),
"Difference_Label",
VAR CurrentValue =
CALCULATE(
[24_KPI Standard voids completed on time (%)],
TREATAS({ 'Dates: DateTable'[MonthStart] }, 'Data PRS 2_15: PR22'[MonthStart])
)
VAR PrevValue =
CALCULATE(
[24_KPI Standard voids completed on time (%)],
TREATAS({ EDATE('Dates: DateTable'[MonthStart], -1) }, 'Data PRS 2_15: PR22'[MonthStart])
)
VAR Diff = CurrentValue - PrevValue
RETURN
IF(
ISBLANK(Diff) || ISBLANK(PrevValue),
BLANK(),
IF(
Diff > 0, "▲ " & FORMAT(Diff, "0.0%"),
IF( Diff < 0, "▼ " & FORMAT(ABS(Diff), "0.0%"), "→ 0.0%" )
)
)
),
"KPI_Name", [KPI_Name],
"Month", [MonthStart],
"Value", [Value],
"TimeValue", "",
"Trend", [Trend],
"Target", [Target],
"Tolerance",[Tolerance],
"Variance", [Variance],
"Status", [Status],
"Difference_Label", [Difference_Label]
)
,
-- ─────── KPI 31 ───────
SELECTCOLUMNS(
ADDCOLUMNS(
FILTER(
SUMMARIZE('Dates: DateTable', 'Dates: DateTable'[MonthStart]),
'Dates: DateTable'[MonthStart] >= DATE(2025,4,1)
&& 'Dates: DateTable'[MonthStart] <= PrevMonthEnd
),
"KPI_Name", "(31) Avg days to attend D&M Inspection",
"Value",
CALCULATE(
[31_KPI Avg days to attend M&C inspection],
TREATAS({ 'Dates: DateTable'[MonthStart] }, 'Data PRS 1_6: Orders'[MonthStart])
),
"Trend",
FORMAT(
CALCULATE(
[31_KPI Avg days to attend M&C inspection],
TREATAS({ 'Dates: DateTable'[MonthStart] }, 'Data PRS 1_6: Orders'[MonthStart])
),"0.0"),
"Target", [31_T KPI Avg days to attend M&C inspection],
"Tolerance", [31_LT KPI Avg days to attend M&C inspection],
"Variance",
CALCULATE(
[31_KPI Avg days to attend M&C inspection],
TREATAS({ 'Dates: DateTable'[MonthStart] }, 'Data PRS 1_6: Orders'[MonthStart])
) - [31_T KPI Avg days to attend M&C inspection],
"Status",
SWITCH(
TRUE(),
CALCULATE(
[31_KPI Avg days to attend M&C inspection],
TREATAS({ 'Dates: DateTable'[MonthStart] }, 'Data PRS 1_6: Orders'[MonthStart])
) > [31_LT KPI Avg days to attend M&C inspection], "Behind",
CALCULATE(
[31_KPI Avg days to attend M&C inspection],
TREATAS({ 'Dates: DateTable'[MonthStart] }, 'Data PRS 1_6: Orders'[MonthStart])
) > [31_T KPI Avg days to attend M&C inspection], "Tolerance",
"Satisfied"
),
"Difference_Label",
VAR CurrentValue2 =
CALCULATE(
[31_KPI Avg days to attend M&C inspection],
TREATAS({ 'Dates: DateTable'[MonthStart] }, 'Data PRS 1_6: Orders'[MonthStart])
)
VAR PrevValue2 =
CALCULATE(
[31_KPI Avg days to attend M&C inspection],
TREATAS({ EDATE('Dates: DateTable'[MonthStart], -1) }, 'Data PRS 1_6: Orders'[MonthStart])
)
VAR Diff2 = CurrentValue2 - PrevValue2
RETURN
IF(
ISBLANK(Diff2) || ISBLANK(PrevValue2),
BLANK(),
IF(
Diff2 > 0,
"▲ " & FORMAT(Diff2, "0.0"),
IF(
Diff2 < 0,
"▼ " & FORMAT(ABS(Diff2), "0.0"),
"→ 0.0"
)
)
)
),
"KPI_Name", [KPI_Name],
"Month", [MonthStart],
"Value", [Value],
"TimeValue", "",
"Trend", [Trend],
"Target", [Target],
"Tolerance",[Tolerance],
"Variance", [Variance],
"Status", [Status],
"Difference_Label", [Difference_Label]
),
-- ─────── KPI 10 ───────
SELECTCOLUMNS(
ADDCOLUMNS(
FILTER(
SUMMARIZE('Dates: DateTable', 'Dates: DateTable'[MonthStart]),
'Dates: DateTable'[MonthStart] >= DATE(2025,4,1)
&& 'Dates: DateTable'[MonthStart] <= PrevMonthEnd
),
"KPI_Name", "(10) No access on Responsive repairs",
"Value",
CALCULATE(
[10_KPI: No access on Responsive repairs (%)],
TREATAS({ 'Dates: DateTable'[MonthStart] }, 'Data PRS 1_6: Orders'[MonthStart])
),
"Trend",
FORMAT(
CALCULATE(
[10_KPI: No access on Responsive repairs (%)],
TREATAS({ 'Dates: DateTable'[MonthStart] }, 'Data PRS 1_6: Orders'[MonthStart])
),"0.0%"),
"Target", [10_KPI_T: No access on Responsive repairs (%)],
"Tolerance", [10_KPI_LT: No access on Responsive repairs (%)],
"Variance",
CALCULATE(
[10_KPI: No access on Responsive repairs (%)],
TREATAS({ 'Dates: DateTable'[MonthStart] }, 'Data PRS 1_6: Orders'[MonthStart])
) - [10_KPI_T: No access on Responsive repairs (%)],
"Status",
SWITCH(
TRUE(),
CALCULATE(
[10_KPI: No access on Responsive repairs (%)],
TREATAS({ 'Dates: DateTable'[MonthStart] }, 'Data PRS 1_6: Orders'[MonthStart])
) > [10_KPI_LT: No access on Responsive repairs (%)], "Behind",
CALCULATE(
[10_KPI: No access on Responsive repairs (%)],
TREATAS({ 'Dates: DateTable'[MonthStart] }, 'Data PRS 1_6: Orders'[MonthStart])
) > [10_KPI_T: No access on Responsive repairs (%)], "Tolerance",
"Satisfied"
),
"Difference_Label",
VAR CurrentValue =
CALCULATE(
[10_KPI: No access on Responsive repairs (%)],
TREATAS({ 'Dates: DateTable'[MonthStart] }, 'Data PRS 1_6: Orders'[MonthStart])
)
VAR PrevValue =
CALCULATE(
[10_KPI: No access on Responsive repairs (%)],
TREATAS({ EDATE('Dates: DateTable'[MonthStart], -1) }, 'Data PRS 1_6: Orders'[MonthStart])
)
VAR Diff = CurrentValue - PrevValue
RETURN
IF(
ISBLANK(Diff) || ISBLANK(PrevValue),
BLANK(),
IF(
Diff > 0, "▲ " & FORMAT(Diff, "0.0%"),
IF( Diff < 0, "▼ " & FORMAT(ABS(Diff), "0.0%"), "→ 0.0%" )
)
)
),
"KPI_Name", [KPI_Name],
"Month", [MonthStart],
"Value", [Value],
"TimeValue", "",
"Trend", [Trend],
"Target", [Target],
"Tolerance",[Tolerance],
"Variance", [Variance],
"Status", [Status],
"Difference_Label", [Difference_Label]
),
-- ─────── KPI 12 ───────
SELECTCOLUMNS(
ADDCOLUMNS(
FILTER(
SUMMARIZE('Dates: DateTable', 'Dates: DateTable'[MonthStart]),
'Dates: DateTable'[MonthStart] >= DATE(2025,4,1)
&& 'Dates: DateTable'[MonthStart] <= PrevMonthEnd
),
"KPI_Name", "(12) Follow-Ons made - Materials",
"Value",
CALCULATE(
[12_KPI: Follow-Ons made - Materials (%)],
TREATAS({ 'Dates: DateTable'[MonthStart] }, 'Data PRS 1_6: Orders'[MonthStart])
),
"Trend",
FORMAT(
CALCULATE(
[12_KPI: Follow-Ons made - Materials (%)],
TREATAS({ 'Dates: DateTable'[MonthStart] }, 'Data PRS 1_6: Orders'[MonthStart])
),"0.0%"),
"Target", [12_KPI_T: Follow-Ons made - Materials (%)],
"Tolerance", [12_KPI_LT: Follow-Ons made - Materials (%)],
"Variance",
CALCULATE(
[12_KPI: Follow-Ons made - Materials (%)],
TREATAS({ 'Dates: DateTable'[MonthStart] }, 'Data PRS 1_6: Orders'[MonthStart])
) - [12_KPI_T: Follow-Ons made - Materials (%)],
"Status",
SWITCH(
TRUE(),
CALCULATE(
[12_KPI: Follow-Ons made - Materials (%)],
TREATAS({ 'Dates: DateTable'[MonthStart] }, 'Data PRS 1_6: Orders'[MonthStart])
) > [12_KPI_LT: Follow-Ons made - Materials (%)], "Behind",
CALCULATE(
[12_KPI: Follow-Ons made - Materials (%)],
TREATAS({ 'Dates: DateTable'[MonthStart] }, 'Data PRS 1_6: Orders'[MonthStart])
) > [12_KPI_T: Follow-Ons made - Materials (%)], "Tolerance",
"Satisfied"
),
"Difference_Label",
VAR CurrentValue2 =
CALCULATE(
[12_KPI: Follow-Ons made - Materials (%)],
TREATAS({ 'Dates: DateTable'[MonthStart] }, 'Data PRS 1_6: Orders'[MonthStart])
)
VAR PrevValue2 =
CALCULATE(
[12_KPI: Follow-Ons made - Materials (%)],
TREATAS({ EDATE('Dates: DateTable'[MonthStart], -1) }, 'Data PRS 1_6: Orders'[MonthStart])
)
VAR Diff2 = CurrentValue2 - PrevValue2
RETURN
IF(
ISBLANK(Diff2) || ISBLANK(PrevValue2),
BLANK(),
IF(
Diff2 > 0,
"▲ " & FORMAT(Diff2, "0.0%"),
IF(
Diff2 < 0,
"▼ " & FORMAT(ABS(Diff2), "0.0%"),
"→ 0.0%"
)
)
)
),
"KPI_Name", [KPI_Name],
"Month", [MonthStart],
"Value", [Value],
"TimeValue", "",
"Trend", [Trend],
"Target", [Target],
"Tolerance",[Tolerance],
"Variance", [Variance],
"Status", [Status],
"Difference_Label", [Difference_Label]
),
-- ─────── KPI 29 ───────
SELECTCOLUMNS(
ADDCOLUMNS(
FILTER(
SUMMARIZE('Dates: DateTable', 'Dates: DateTable'[MonthStart]),
'Dates: DateTable'[MonthStart] >= DATE(2025,4,1)
&& 'Dates: DateTable'[MonthStart] <= PrevMonthEnd
),
"KPI_Name", "(29) Repairs - Jobs per day",
"Value",
CALCULATE(
[29_KPI_JPTPD_All (Responsive)],
TREATAS({ 'Dates: DateTable'[MonthStart] }, 'Data PRS 2_13: Visits + Visit Resources + Resources'[MonthStart])
),
"Trend",
FORMAT(
CALCULATE(
[29_KPI_JPTPD_All (Responsive)],
TREATAS({ 'Dates: DateTable'[MonthStart] }, 'Data PRS 2_13: Visits + Visit Resources + Resources'[MonthStart])
),"0.00"),
"Target", [29_KPI_T_JPTPD_All],
"Tolerance", [29_KPI_LT_JPTPD_All],
"Variance",
CALCULATE(
[29_KPI_JPTPD_All (Responsive)],
TREATAS({ 'Dates: DateTable'[MonthStart] }, 'Data PRS 2_13: Visits + Visit Resources + Resources'[MonthStart])
) - [29_KPI_T_JPTPD_All],
"Status",
SWITCH(
TRUE(),
CALCULATE(
[29_KPI_JPTPD_All (Responsive)],
TREATAS({ 'Dates: DateTable'[MonthStart] },'Data PRS 2_13: Visits + Visit Resources + Resources'[MonthStart])
) < [29_KPI_LT_JPTPD_All], "Behind",
CALCULATE(
[29_KPI_JPTPD_All (Responsive)],
TREATAS({ 'Dates: DateTable'[MonthStart] }, 'Data PRS 2_13: Visits + Visit Resources + Resources'[MonthStart])
) < [29_KPI_T_JPTPD_All], "Tolerance",
"Satisfied"
),
"Difference_Label",
VAR CurrentValue2 =
CALCULATE(
[29_KPI_JPTPD_All (Responsive)],
TREATAS({ 'Dates: DateTable'[MonthStart] }, 'Data PRS 2_13: Visits + Visit Resources + Resources'[MonthStart])
)
VAR PrevValue2 =
CALCULATE(
[29_KPI_JPTPD_All (Responsive)],
DATEADD('Dates: DateTable'[Date], -1, MONTH)
)
VAR Diff2 = CurrentValue2 - PrevValue2
RETURN
IF(
ISBLANK(Diff2) || ISBLANK(PrevValue2),
BLANK(),
IF(
Diff2 > 0,
"▲" & FORMAT(Diff2, "0.00"),
IF(
Diff2 < 0,
"▼" & FORMAT(ABS(Diff2), "0.00"),
"→ 0.00"
)
)
)
),
"KPI_Name", [KPI_Name],
"Month", [MonthStart],
"Value", [Value],
"TimeValue", "",
"Trend", [Trend],
"Target", [Target],
"Tolerance",[Tolerance],
"Variance", [Variance],
"Status", [Status],
"Difference_Label", [Difference_Label]
),
-- ─────── KPI 15 ───────
SELECTCOLUMNS(
ADDCOLUMNS(
FILTER(
SUMMARIZE('Dates: DateTable', 'Dates: DateTable'[MonthStart]),
'Dates: DateTable'[MonthStart] >= DATE(2025,4,1)
&& 'Dates: DateTable'[MonthStart] <= PrevMonthEnd
),
"KPI_Name", "(15) Average Responsive Repairs Cost (£)",
"Value",
CALCULATE(
[15_KPI: Average Responsive Repairs Cost (£)],
TREATAS({ 'Dates: DateTable'[MonthStart] }, 'Data PRS 2_17: Orders+Charges'[MonthStart])
),
"Trend",
FORMAT(
CALCULATE(
[15_KPI: Average Responsive Repairs Cost (£)],
TREATAS({ 'Dates: DateTable'[MonthStart] }, 'Data PRS 2_17: Orders+Charges'[MonthStart])
),"0.0"),
"Target", [15_KPI_T: Responsive Repairs Cost Per Property (£)],
"Tolerance", [15_KPI_LT: Responsive Repairs Cost Per Property (£)],
"Variance",
CALCULATE(
[15_KPI: Average Responsive Repairs Cost (£)],
TREATAS({ 'Dates: DateTable'[MonthStart] }, 'Data PRS 2_17: Orders+Charges'[MonthStart])
) - [15_KPI_T: Responsive Repairs Cost Per Property (£)],
"Status",
VAR KPI_Value =
CALCULATE(
[15_KPI: Average Responsive Repairs Cost (£)],
TREATAS({ 'Dates: DateTable'[MonthStart] }, 'Data PRS 2_17: Orders+Charges'[MonthStart])
)
RETURN
SWITCH(
TRUE(),
ISBLANK(KPI_Value), "No Data",
"Trends"
),
"Difference_Label",
VAR CurrentValue2 =
CALCULATE(
[15_KPI: Average Responsive Repairs Cost (£)],
TREATAS({ 'Dates: DateTable'[MonthStart] }, 'Data PRS 2_17: Orders+Charges'[MonthStart])
)
VAR PrevValue2 =
CALCULATE(
[15_KPI: Average Responsive Repairs Cost (£)],
TREATAS({ EDATE('Dates: DateTable'[MonthStart], -1) }, 'Data PRS 2_17: Orders+Charges'[MonthStart])
)
VAR Diff2 = CurrentValue2 - PrevValue2
RETURN
IF(
ISBLANK(Diff2) || ISBLANK(PrevValue2),
BLANK(),
IF(
Diff2 > 0,
"▲" & FORMAT(Diff2, "0.0"),
IF(
Diff2 < 0,
"▼" & FORMAT(ABS(Diff2), "0.0"),
"→ £0.0"
)
)
)
),
"KPI_Name", [KPI_Name],
"Month", [MonthStart],
"Value", [Value],
"TimeValue", "",
"Trend", [Trend],
"Target", [Target],
"Tolerance",[Tolerance],
"Variance", [Variance],
"Status", [Status],
"Difference_Label", [Difference_Label]
),
-- ─────── KPI 15.5 ───────
SELECTCOLUMNS(
ADDCOLUMNS(
FILTER(
SUMMARIZE('Dates: DateTable', 'Dates: DateTable'[MonthStart]),
'Dates: DateTable'[MonthStart] >= DATE(2025,4,1)
&& 'Dates: DateTable'[MonthStart] <= PrevMonthEnd
),
"KPI_Name", "(15.5) Average Major Repairs Cost (£)",
"Value",
CALCULATE(
[15.5_KPI: Average Major Repairs Cost (£)],
TREATAS({ 'Dates: DateTable'[MonthStart] }, 'Data PRS 2_17: Orders+Charges'[MonthStart])
),
"Trend",
FORMAT(
CALCULATE(
[15.5_KPI: Average Major Repairs Cost (£)],
TREATAS({ 'Dates: DateTable'[MonthStart] }, 'Data PRS 2_17: Orders+Charges'[MonthStart])
),"0.0"),
"Target", [15.5_KPI_T: Major Repairs Cost Per Property (£)],
"Tolerance", [15.5_KPI_LT: Major Repairs Cost Per Property (£)],
"Variance",
CALCULATE(
[15.5_KPI: Average Major Repairs Cost (£)],
TREATAS({ 'Dates: DateTable'[MonthStart] }, 'Data PRS 2_17: Orders+Charges'[MonthStart])
) - [15.5_KPI_T: Major Repairs Cost Per Property (£)],
"Status",
VAR KPI_Value =
CALCULATE(
[15.5_KPI: Average Major Repairs Cost (£)],
TREATAS({ 'Dates: DateTable'[MonthStart] }, 'Data PRS 2_17: Orders+Charges'[MonthStart])
)
RETURN
SWITCH(
TRUE(),
ISBLANK(KPI_Value), "No Data",
"Trends"
),
"Difference_Label",
VAR CurrentValue2 =
CALCULATE(
[15.5_KPI: Average Major Repairs Cost (£)],
TREATAS({ 'Dates: DateTable'[MonthStart] }, 'Data PRS 2_17: Orders+Charges'[MonthStart])
)
VAR PrevValue2 =
CALCULATE(
[15.5_KPI: Average Major Repairs Cost (£)],
TREATAS({ EDATE('Dates: DateTable'[MonthStart], -1) }, 'Data PRS 2_17: Orders+Charges'[MonthStart])
)
VAR Diff2 = CurrentValue2 - PrevValue2
RETURN
IF(
ISBLANK(Diff2) || ISBLANK(PrevValue2),
BLANK(),
IF(
Diff2 > 0,
"▲" & FORMAT(Diff2, "0.0"),
IF(
Diff2 < 0,
"▼" & FORMAT(ABS(Diff2), "0.0"),
"→ £0.0"
)
)
)
),
"KPI_Name", [KPI_Name],
"Month", [MonthStart],
"Value", [Value],
"TimeValue", "",
"Trend", [Trend],
"Target", [Target],
"Tolerance",[Tolerance],
"Variance", [Variance],
"Status", [Status],
"Difference_Label", [Difference_Label]
),
-- ─────── KPI 26 ───────
SELECTCOLUMNS(
ADDCOLUMNS(
FILTER(
SUMMARIZE('Dates: DateTable', 'Dates: DateTable'[MonthStart]),
'Dates: DateTable'[MonthStart] >= DATE(2025,4,1)
&& 'Dates: DateTable'[MonthStart] <= PrevMonthEnd
),
"KPI_Name", "(26) Average time to answer calls",
"Value",
CALCULATE(
[26_KPI Avg time to answer calls (mm:ss)],
TREATAS({ 'Dates: DateTable'[MonthStart] }, 'Data PRS 3_21: Inbound Calls (PRS Customer)'[MonthStart])
),
"TimeValue",
CALCULATE(
[26_KPI Avg time to answer calls (mm:ss)],
TREATAS({ 'Dates: DateTable'[MonthStart] }, 'Data PRS 3_21: Inbound Calls (PRS Customer)'[MonthStart])
),
"Trend",
VAR AvgTime =
CALCULATE(
[26_KPI Avg time to answer calls (mm:ss)],
TREATAS(
{ 'Dates: DateTable'[MonthStart] },
'Data PRS 3_21: Inbound Calls (PRS Customer)'[MonthStart]
)
)
VAR TotalSeconds = AvgTime * 86400
VAR Minutes = INT(TotalSeconds / 60)
VAR Seconds = INT(MOD(TotalSeconds, 60))
RETURN
FORMAT(Minutes, "00") & ":" & FORMAT(Seconds, "00")
,
"Target", VAR TargetTime = [26_KPI_T (Number) Avg time to answer calls]
VAR TotalSeconds = TargetTime * 86400
VAR Minutes = INT(TotalSeconds / 60)
VAR Seconds = INT(MOD(TotalSeconds, 60))
RETURN
FORMAT(Minutes, "00") & ":" & FORMAT(Seconds, "00")
,
"Tolerance", VAR TargetTime = [26_KPI_LT (Number) Avg time to answer calls]
VAR TotalSeconds = TargetTime * 86400
VAR Minutes = INT(TotalSeconds / 60)
VAR Seconds = INT(MOD(TotalSeconds, 60))
RETURN
FORMAT(Minutes, "00") & ":" & FORMAT(Seconds, "00")
,
"Variance",
VAR CurrentTime =
CALCULATE(
[26_KPI Avg time to answer calls (mm:ss)],
TREATAS(
{ 'Dates: DateTable'[MonthStart] },
'Data PRS 3_21: Inbound Calls (PRS Customer)'[MonthStart]
)
)
VAR TargetTime = [26_KPI_T (Number) Avg time to answer calls]
VAR DiffSeconds = (CurrentTime - TargetTime) * 86400
VAR Sign =
SWITCH(
TRUE(),
DiffSeconds > 0, "+",
DiffSeconds < 0, "–", -- en dash
""
)
VAR DiffAbs = ABS(DiffSeconds)
VAR Minutes = INT(DiffAbs / 60)
VAR Seconds = INT(MOD(DiffAbs, 60))
RETURN
Sign & FORMAT(Minutes, "00") & ":" & FORMAT(Seconds, "00")
,
"Status",
SWITCH(
TRUE(),
CALCULATE(
[26_KPI Avg time to answer calls (mm:ss)],
TREATAS({ 'Dates: DateTable'[MonthStart] }, 'Data PRS 3_21: Inbound Calls (PRS Customer)'[MonthStart])
) > [26_KPI_LT (Number) Avg time to answer calls], "Behind",
CALCULATE(
[26_KPI Avg time to answer calls (mm:ss)],
TREATAS({ 'Dates: DateTable'[MonthStart] }, 'Data PRS 3_21: Inbound Calls (PRS Customer)'[MonthStart])
) > [26_KPI_T (Number) Avg time to answer calls], "Tolerance",
"Satisfied"
),
"Difference_Label",
VAR CurrentValue =
CALCULATE(
[26_KPI Avg time to answer calls (mm:ss)], -- ← numeric value in time format (fraction of day)
TREATAS({ 'Dates: DateTable'[MonthStart] }, 'Data PRS 3_21: Inbound Calls (PRS Customer)'[MonthStart])
)
VAR PrevValue =
CALCULATE(
[26_KPI Avg time to answer calls (mm:ss)],
TREATAS({ EDATE('Dates: DateTable'[MonthStart], -1) }, 'Data PRS 3_21: Inbound Calls (PRS Customer)'[MonthStart])
)
VAR DiffSeconds = (CurrentValue - PrevValue) * 86400 -- convert from days to seconds
VAR DiffAbs = ABS(DiffSeconds)
VAR Minutes = INT(DiffAbs / 60)
VAR Seconds = INT(MOD(DiffAbs, 60))
VAR Formatted = FORMAT(Minutes, "00") & ":" & FORMAT(Seconds, "00")
RETURN
IF(
ISBLANK(PrevValue) || ISBLANK(CurrentValue),
BLANK(),
SWITCH(
TRUE(),
DiffSeconds > 0, "▲ " & Formatted,
DiffSeconds < 0, "▼ " & Formatted,
"→ 00:00"
)
)),
"KPI_Name", [KPI_Name],
"Month", [MonthStart],
"Value", [Value],
"TimeValue", [TimeValue],
"Trend", [Trend],
"Target", [Target],
"Tolerance",[Tolerance],
"Variance", [Variance],
"Status", [Status],
"Difference_Label", [Difference_Label]
),
-- ─────── KPI 27 ───────
SELECTCOLUMNS(
ADDCOLUMNS(
FILTER(
SUMMARIZE('Dates: DateTable', 'Dates: DateTable'[MonthStart]),
'Dates: DateTable'[MonthStart] >= DATE(2025,4,1)
&& 'Dates: DateTable'[MonthStart] <= PrevMonthEnd
),
"KPI_Name", "(27) Abandoned Calls",
"Value",
CALCULATE(
[27_KPI Abandoned calls],
TREATAS({ 'Dates: DateTable'[MonthStart] }, 'Data PRS 3_21: Inbound Calls (PRS Customer)'[MonthStart])
),
"TimeValue",
CALCULATE(
[26_KPI Avg time to answer calls (mm:ss)],
TREATAS({ 'Dates: DateTable'[MonthStart] }, 'Data PRS 3_21: Inbound Calls (PRS Customer)'[MonthStart])
),
"Trend",
FORMAT(
CALCULATE(
[27_KPI Abandoned calls],
TREATAS({ 'Dates: DateTable'[MonthStart] }, 'Data PRS 3_21: Inbound Calls (PRS Customer)'[MonthStart])
),"0.0%"),
"Target", [27_KPI_T Abandoned calls],
"Tolerance", [27_KPI_LT Abandoned calls],
"Variance",
VAR Diff =
CALCULATE(
[27_KPI Abandoned calls],
TREATAS(
{ 'Dates: DateTable'[MonthStart] },
'Data PRS 3_21: Inbound Calls (PRS Customer)'[MonthStart]
)
) - [27_KPI_T Abandoned calls]
RETURN
IF(
ISBLANK(Diff),
BLANK(),
SWITCH(
TRUE(),
Diff > 0, "+" & FORMAT(Diff, "0.0%"),
Diff < 0, "–" & FORMAT(ABS(Diff), "0.0%"),
"0.0%"
)
)
,
"Status",
SWITCH(
TRUE(),
CALCULATE(
[27_KPI Abandoned calls],
TREATAS({ 'Dates: DateTable'[MonthStart] }, 'Data PRS 3_21: Inbound Calls (PRS Customer)'[MonthStart])
) > [27_KPI_LT Abandoned calls], "Behind",
CALCULATE(
[27_KPI Abandoned calls],
TREATAS({ 'Dates: DateTable'[MonthStart] }, 'Data PRS 3_21: Inbound Calls (PRS Customer)'[MonthStart])
) > [27_KPI_T Abandoned calls], "Tolerance",
"Satisfied"
),
"Difference_Label",
VAR CurrentValue =
CALCULATE(
[27_KPI Abandoned calls],
TREATAS({ 'Dates: DateTable'[MonthStart] }, 'Data PRS 3_21: Inbound Calls (PRS Customer)'[MonthStart])
)
VAR PrevValue =
CALCULATE(
[27_KPI Abandoned calls],
TREATAS({ EDATE('Dates: DateTable'[MonthStart], -1) }, 'Data PRS 3_21: Inbound Calls (PRS Customer)'[MonthStart])
)
VAR Diff = CurrentValue - PrevValue
RETURN
IF(
ISBLANK(Diff) || ISBLANK(PrevValue),
BLANK(),
IF(
Diff > 0, "▲ " & FORMAT(Diff, "0.0%"),
IF( Diff < 0, "▼ " & FORMAT(ABS(Diff), "0.0%"), "→ 0.0%" )
)
)
),
"KPI_Name", [KPI_Name],
"Month", [MonthStart],
"Value", [Value],
"TimeValue", [TimeValue],
"Trend", [Trend],
"Target", [Target],
"Tolerance",[Tolerance],
"Variance", [Variance],
"Status", [Status],
"Difference_Label", [Difference_Label]
),
-- ─────── KPI 27 ───────
SELECTCOLUMNS(
ADDCOLUMNS(
FILTER(
SUMMARIZE('Dates: DateTable', 'Dates: DateTable'[MonthStart]),
'Dates: DateTable'[MonthStart] >= DATE(2025,4,1)
&& 'Dates: DateTable'[MonthStart] <= PrevMonthEnd
),
"KPI_Name", "(1) RP02: Repairs completed within target timescales",
"Value",
CALCULATE(
[1_KPI: Repairs completed on time (%)],
TREATAS({ 'Dates: DateTable'[MonthStart] }, 'Data PRS 2_19: All Completed Repairs'[MonthStart])
),
"Trend",
FORMAT(
CALCULATE(
[1_KPI: Repairs completed on time (%)],
TREATAS({ 'Dates: DateTable'[MonthStart] }, 'Data PRS 2_19: All Completed Repairs'[MonthStart])
),"0.0%"),
"Target", [1_KPI_T: Repairs completed within target timescales (%)],
"Tolerance", [1_KPI_LT: Repairs completed within target timescales (%)],
"Variance",
CALCULATE(
[1_KPI: Repairs completed on time (%)],
TREATAS(
{ 'Dates: DateTable'[MonthStart] },
'Data PRS 2_19: All Completed Repairs'[MonthStart]
)
) - [1_KPI_T: Repairs completed within target timescales (%)]
,
"Status",
SWITCH(
TRUE(),
CALCULATE(
[1_KPI: Repairs completed on time (%)],
TREATAS({ 'Dates: DateTable'[MonthStart] }, 'Data PRS 2_19: All Completed Repairs'[MonthStart])
) < [1_KPI_LT: Repairs completed within target timescales (%)], "Behind",
CALCULATE(
[1_KPI: Repairs completed on time (%)],
TREATAS({ 'Dates: DateTable'[MonthStart] }, 'Data PRS 2_19: All Completed Repairs'[MonthStart])
) < [1_KPI_T: Repairs completed within target timescales (%)], "Tolerance",
"Satisfied"
),
"Difference_Label",
VAR CurrentValue =
CALCULATE(
[1_KPI: Repairs completed on time (%)],
TREATAS({ 'Dates: DateTable'[MonthStart] }, 'Data PRS 2_19: All Completed Repairs'[MonthStart])
)
VAR PrevValue =
CALCULATE(
[1_KPI: Repairs completed on time (%)],
TREATAS({ EDATE('Dates: DateTable'[MonthStart], -1) }, 'Data PRS 2_19: All Completed Repairs'[MonthStart])
)
VAR Diff = CurrentValue - PrevValue
RETURN
IF(
ISBLANK(Diff) || ISBLANK(PrevValue),
BLANK(),
IF(
Diff > 0, "▲ " & FORMAT(Diff, "0.0%"),
IF( Diff < 0, "▼ " & FORMAT(ABS(Diff), "0.0%"), "→ 0.0%" )
)
)
),
"KPI_Name", [KPI_Name],
"Month", [MonthStart],
"Value", [Value],
"TimeValue", "",
"Trend", [Trend],
"Target", [Target],
"Tolerance",[Tolerance],
"Variance", [Variance],
"Status", [Status],
"Difference_Label", [Difference_Label]
)
)Vega-lite JSON: Using the Deneb custom visual, built the custom JSON visual in Power BI.
{
"$schema": "https://vega.github.io/schema/vega-lite/v5.json",
"data": { "name": "dataset" },
"vconcat": [
// ─── HEADER ROW ───
{
"data": {
"values": [
{
"spacer": "",
"col1": "Metric Name",
"col2": "Month",
"col3": "Status",
"col4": "Current",
"col5": "Main \ntarget",
"col6": "Tolerance",
"col7": "Target \ndifference",
"col8": "Diff. \n from prev.",
"col9": "Trend"
}
]
},
"hconcat": [
{
"mark": { "type": "text", "align": "left", "fontWeight": "bold", "fontSize": 15, "dx": -68, "lineBreak": "\n"},
"encoding": { "text": { "field": "col1", "type": "nominal" } },
"width": 10, "height": 20
},
{
"mark": { "type": "text", "align": "left", "fontWeight": "bold", "fontSize": 15 ,"dx": 28},
"encoding": { "text": { "field": "col2", "type": "nominal" } },
"width": 5
},
{
"mark": { "type": "text", "align": "left", "fontWeight": "bold","fontSize": 15,"dx": 17 },
"encoding": { "text": { "field": "col3", "type": "nominal" } },
"width": 35
},
{
"mark": { "type": "text", "align": "left", "fontWeight": "bold","fontSize": 15,"dx": -5 },
"encoding": { "text": { "field": "col4", "type": "nominal" } },
"width": 30
},
{
"mark": { "type": "text", "align": "left", "fontWeight": "bold","fontSize": 15,"lineBreak": "\n","dx": 5 },
"encoding": { "text": { "field": "col5", "type": "nominal" } },
"width": 5
},
{
"mark": { "type": "text", "align": "left", "fontWeight": "bold","fontSize": 15,"lineBreak": "\n","dx": -10 },
"encoding": { "text": { "field": "col6", "type": "nominal" } },
"width": 10
},
{
"mark": { "type": "text", "align": "left", "fontWeight": "bold" ,"fontSize": 15,"dx": -20 , "lineBreak": "\n"},
"encoding": { "text": { "field": "col7", "type": "nominal" } },
"width": -10
},
{
"mark": { "type": "text", "align": "left", "fontWeight": "bold" ,"fontSize": 15, "lineBreak": "\n","dx": -10},
"encoding": { "text": { "field": "col8", "type": "nominal" } },
"width": 2
},
{
"mark": { "type": "text", "align": "left", "fontWeight": "bold","fontSize": 15,"dx": 60 },
"encoding": { "text": { "field": "col9", "type": "nominal" } },
"width": 5
}
]
},
// ─── DATA ROWS ───
{
"facet": {
"row": {
"field": "KPI_Name",
"type": "nominal",
"sort": [
"(1) Performance KPI",
"(2) Performance KPI",
"(3) Performance KPI",
"(4) Performance KPI",
"(5) Performance KPI",
"(6) Performance KPI",
"(7) Performance KPI",
"(8) Performance KPI"
],
"header": {
"title": null,
"labels": false,
"labelPadding": 0,
"labelFontSize": 0
}
}
},
"spec": {
"hconcat": [
// (1) KPI Name cell: truncated or padded to exactly 30 characters
{
"transform": [
{
"calculate": "slice(datum.KPI_Name + ' ', 0, 70)",
"as": "PaddedKPI"
},
{ "filter": "datum.Month <= now()" },
{
"window": [{ "op": "rank", "as": "rank" }],
"sort": [{ "field": "Month", "order": "descending" }],
"groupby": ["KPI_Name"]
},
{ "filter": "datum.rank === 1" }
],
"mark": { "type": "text", "align": "right", "fontWeight": "bold","fontSize": 13 },
"encoding": {
"text": { "field": "PaddedKPI", "type": "nominal" },
"color": { "value": "#666" }
},
"width": 50,
"height": 30
},
// (2) As of Date (latest month)
{
"transform": [
{ "filter": "datum.Month <= now()" },
{
"window": [{ "op": "rank", "as": "rank" }],
"sort": [{ "field": "Month", "order": "descending" }],
"groupby": ["KPI_Name"]
},
{ "filter": "datum.rank === 1" }
],
"mark": { "type": "text", "align": "right","fontSize": 14 },
"encoding": {
"text": { "field": "Month", "type": "temporal", "format": "%b %Y" },
"color": { "value": "#666" }
},
"width": 35,
"height": 30
},
// (3) Status (latest month)
{
"transform": [
{ "filter": "datum.Month <= now()" },
{
"window": [{ "op": "rank", "as": "rank" }],
"sort": [{ "field": "Month", "order": "descending" }],
"groupby": ["KPI_Name"]
},
{ "filter": "datum.rank === 1" }
],
"mark": { "type": "text", "align": "center","fontSize": 14, "fontWeight": "bold" },
"encoding": {
"text": { "field": "Status", "type": "nominal" },
"color": {
"condition": [
{ "test": "datum.Status == 'Behind'", "value": "#E03A3E" },
{ "test": "datum.Status == 'Tolerance'", "value": "#E5AB00" },
{ "test": "datum.Status == 'Satisfied'", "value": "#107C10" },
{ "test": "datum.Status == 'Trends'", "value": "#0078D4" }
],
"value": "#666"
}
},
"width": 70,
"height": 30
},
// (4) Current Value (latest month, formatted per KPI)
{
"transform": [
{
"calculate":
"datum.KPI_Name == null || datum.Value == null ? '' : (datum.KPI_Name === '(1) Performance KPI' ? format(datum.Value, '.0f') : (datum.KPI_Name === '(2) Performance KPI' ? format(datum.Value, '.0%') : (datum.KPI_Name === '(3) Performance KPI' ? format(datum.Value, '.0f') : (datum.KPI_Name === '(4) Performance KPI' ? format(datum.Value, '.3') : (datum.KPI_Name === '(5) Performance KPI' ? format(datum.Value, '.0%') : (datum.KPI_Name === '(8) Performance KPI' ? format(datum.Value, '.0%') : format(datum.Value, '.0f')))))))",
"as": "FormattedValue"
},
{ "filter": "datum.Month <= now()" },
{
"window": [{ "op": "rank", "as": "rank" }],
"sort": [{ "field": "Month", "order": "descending" }],
"groupby": ["KPI_Name"]
},
{ "filter": "datum.rank === 1" }
],
"mark": { "type": "text", "align": "center","fontSize": 14, "fontWeight": "bold" },
"encoding": {
"text": { "field": "FormattedValue", "type": "nominal" },
"color": {
"condition": [
],
"value": "#666"
}
},
"width": 50,
"height": 30
},
// (6) Main Target (latest month)
{
"transform": [
{
"calculate": "datum.KPI_Name == null || datum.Target == null ? '' : (datum.KPI_Name === '(2) Performance KPI' ? format(datum.Target, '.0%') : (datum.KPI_Name === '(5) Performance KPI' ? format(datum.Target, '.0%') : (datum.KPI_Name === '(8) Performance KPI' ? format(datum.Target, '.0%') : format(datum.Target, '.0f'))))",
"as": "FormattedTarget"
},
{ "filter": "datum.Month <= now()" },
{
"window": [{ "op": "rank", "as": "rank" }],
"sort": [{ "field": "Month", "order": "descending" }],
"groupby": ["KPI_Name"]
},
{ "filter": "datum.rank === 1" }
],
"mark": { "type": "text", "align": "center","fontSize": 14, "fontWeight": "bold" },
"encoding": {
"text": { "field": "FormattedTarget", "type": "nominal" },
"color": { "value": "#666" }
},
"width": 60,
"height": 30
},
// (7) Tolerance (latest month)
{
"transform": [
{
"calculate": "datum.KPI_Name == null || datum.Tolerance == null ? '' : (datum.KPI_Name === '(2) Performance KPI' ? format(datum.Tolerance, '.0%') : (datum.KPI_Name === '(5) Performance KPI' ? format(datum.Tolerance, '.0%') : (datum.KPI_Name === '(8) Performance KPI' ? format(datum.Tolerance, '.0%') : format(datum.Tolerance, '.0f'))))",
"as": "FormattedTolerance"
},
{ "filter": "datum.Month <= now()" },
{
"window": [{ "op": "rank", "as": "rank" }],
"sort": [{ "field": "Month", "order": "descending" }],
"groupby": ["KPI_Name"]
},
{ "filter": "datum.rank === 1" }
],
"mark": { "type": "text", "align": "center" ,"fontSize": 14, "fontWeight": "bold"},
"encoding": {
"text": { "field": "FormattedTolerance", "type": "nominal" },
"color": { "value": "#666" }
},
"width": 50,
"height": 30
},
// (8) Diff from Target (Variance) (latest month)
{
"transform": [
{
"calculate":
"datum.Value == null || datum.Variance == null ? '' : (datum.KPI_Name === '(2) Performance KPI' ? format(datum.Variance, '+.0%') : (datum.KPI_Name === '(5) Performance KPI' ? format(datum.Variance, '+.0%') : (datum.KPI_Name === '(8) Performance KPI' ? format(datum.Variance, '+.0%') : format(datum.Variance, '+.2f'))))",
"as": "FormattedVariance"
},
{ "filter": "datum.Month <= now()" },
{
"window": [{ "op": "rank", "as": "rank" }],
"sort": [{ "field": "Month", "order": "descending" }],
"groupby": ["KPI_Name"]
},
{ "filter": "datum.rank === 1" }
],
"mark": { "type": "text", "align": "center" ,"fontSize": 14, "fontWeight": "bold"},
"encoding": {
"text": { "field": "FormattedVariance", "type": "nominal" },
"color": {
"condition": [
{
"test": "datum.KPI_Name == '(1) Performance KPI' && datum.Variance < 0",
"value": "#107C10"
},
{
"test": "datum.KPI_Name == '(1) Performance KPI' && datum.Variance > 0",
"value": "#E03A3E"
},
{
"test": "datum.KPI_Name == '(2) Performance KPI' && datum.Variance > 0",
"value": "#107C10"
},
{
"test": "datum.KPI_Name == '(2) Performance KPI' && datum.Variance < 0",
"value": "#E03A3E"
},
{
"test": "datum.KPI_Name == '(3) Performance KPI' && datum.Variance < 0",
"value": "#E03A3E"
},
{
"test": "datum.KPI_Name == '(3) Performance KPI' && datum.Variance > 0",
"value": "#107C10"
},
{
"test": "datum.KPI_Name == '(4) Performance KPI' && datum.Variance < 0",
"value": "#107C10"
},
{
"test": "datum.KPI_Name == '(4) Performance KPI' && datum.Variance > 0",
"value": "#E03A3E"
},
{
"test": "datum.KPI_Name == '(5) Performance KPI' && datum.Variance < 0",
"value": "#E03A3E"
},
{
"test": "datum.KPI_Name == '(5) Performance KPI' && datum.Variance > 0",
"value": "#107C10"
},
{
"test": "datum.KPI_Name == '(6) Performance KPI' && datum.Variance < 0",
"value": "#E03A3E"
},
{
"test": "datum.KPI_Name == '(6) Performance KPI' && datum.Variance > 0",
"value": "#107C10"
},
{
"test": "datum.KPI_Name == '(7) Performance KPI' && datum.Variance < 0",
"value": "#E03A3E"
},
{
"test": "datum.KPI_Name == '(7) Performance KPI' && datum.Variance > 0",
"value": "#107C10"
},
{
"test": "datum.KPI_Name == '(8) Performance KPI' && datum.Variance > 0",
"value": "#107C10"
},
{
"test": "datum.KPI_Name == '(8) Performance KPI' && datum.Variance < 0",
"value": "#E03A3E"
}
],
"value": "#666"
}
},
"width": 80,
"height": 30
},
// (5) Difference from Prev. (latest month)
{
"transform": [
{
"calculate": "datum.Value == null || datum.Difference_Label == null ? '' : datum.Difference_Label",
"as": "Difference_Label"
},
{ "filter": "datum.Month <= now()" },
{
"window": [{ "op": "rank", "as": "rank" }],
"sort": [{ "field": "Month", "order": "descending" }],
"groupby": ["KPI_Name"]
},
{ "filter": "datum.rank === 1" }
],
"mark": { "type": "text", "align": "center" ,"fontSize": 14, "fontWeight": "bold"},
"encoding": {
"text": { "field": "Difference_Label", "type": "nominal" },
"color": {
"condition": [
{
"test": "datum.KPI_Name === '(1) Performance KPI' && indexof(datum.Difference_Label, '▲') === 0",
"value": "#E03A3E" // up = green for KPI (1)
},
{
"test": "datum.KPI_Name === '(1) Performance KPI' && indexof(datum.Difference_Label, '▼') === 0",
"value": "#107C10" // down = red for KPI (1)
},
{
"test": "datum.KPI_Name === '(2) Performance KPI' && indexof(datum.Difference_Label, '▲') === 0",
"value": "#107C10" // up = red for KPI (15)
},
{
"test": "datum.KPI_Name === '(2) Performance KPI' && indexof(datum.Difference_Label, '▼') === 0",
"value": "#E03A3E" // down = green for KPI (15)
},
{
"test": "datum.KPI_Name === '(3) Performance KPI' && indexof(datum.Difference_Label, '▲') === 0",
"value": "#107C10" // up = green for KPI (15PN)
},
{
"test": "datum.KPI_Name === '(3) Performance KPI' && indexof(datum.Difference_Label, '▼') === 0",
"value": "#E03A3E" // down = red for KPI (15PN)
},
{
"test": "datum.KPI_Name === '(4) Performance KPI' && indexof(datum.Difference_Label, '▲') === 0",
"value": "#E03A3E" // up = green for KPI (16PN)
},
{
"test": "datum.KPI_Name === '(4) Performance KPI' && indexof(datum.Difference_Label, '▼') === 0",
"value": "#107C10" // down = red for KPI (16PN)
},
{
"test": "datum.KPI_Name === '(5) Performance KPI' && indexof(datum.Difference_Label, '▲') === 0",
"value": "#107C10" // up = red for KPI (2)
},
{
"test": "datum.KPI_Name === '(5) Performance KPI' && indexof(datum.Difference_Label, '▼') === 0",
"value": "#E03A3E" // down = green for KPI (2)
},
{
"test": "datum.KPI_Name === '(6) Performance KPI' && indexof(datum.Difference_Label, '▲') === 0",
"value": "#107C10" // up = green for KPI (5)
},
{
"test": "datum.KPI_Name === '(6) Performance KPI' && indexof(datum.Difference_Label, '▼') === 0",
"value": "#E03A3E" // down = red for KPI (5)
},
{
"test": "datum.KPI_Name === '(7) Performance KPI' && indexof(datum.Difference_Label, '▲') === 0",
"value": "#107C10" // up = green for KPI (6)
},
{
"test": "datum.KPI_Name === '(7) Performance KPI' && indexof(datum.Difference_Label, '▼') === 0",
"value": "#E03A3E" // down = red for KPI (6)
},
{
"test": "datum.KPI_Name === '(8) Performance KPI' && indexof(datum.Difference_Label, '▲') === 0",
"value": "#107C10" // up = green for KPI (7)
},
{
"test": "datum.KPI_Name === '(8) Performance KPI' && indexof(datum.Difference_Label, '▼') === 0",
"value": "#E03A3E" // down = red for KPI (7)
},
{
"test": "datum.KPI_Name === '(8) Subcontractor use - Responsive Repairs' && indexof(datum.Difference_Label, '▲') === 0",
"value": "#E03A3E" // up = green for KPI (8)
},
{
"test": "datum.KPI_Name === '(8) Subcontractor use - Responsive Repairs' && indexof(datum.Difference_Label, '▼') === 0",
"value": "#107C10" // down = red for KPI (8)
},
{
"test": "datum.KPI_Name === '(9) Responsive Repairs - Fixed first time' && indexof(datum.Difference_Label, '▲') === 0",
"value": "#107C10" // up = green for KPI (9)
},
{
"test": "datum.KPI_Name === '(9) Responsive Repairs - Fixed first time' && indexof(datum.Difference_Label, '▼') === 0",
"value": "#E03A3E" // down = red for KPI (9)
}
],
"value": "#999" // default grey for neutral (→) or blank
}
},
"width": 60,
"height": 30
},
// (9) Trend sparkline (all months up to today)
{
"transform": [{ "filter": "datum.Month <= now()" }],
"mark": { "type": "line", "point": true, "tooltip": true,
"stroke": "#222222" },
"encoding": {
"x": { "field": "Month", "type": "temporal", "axis": null },
"y": {
"field": "Value",
"type": "quantitative",
"axis": {
"orient": "center",
"domain": false,
"ticks": false,
"grid": false,
"labels": false,
"labelFontSize": 8,
"title": ""
}
},
"color": {
"condition": [
{ "test": "datum.Status == 'Behind'", "value": "#E03A3E" },
{ "test": "datum.Status == 'Tolerance'", "value": "#E5AB00" },
{ "test": "datum.Status == 'Satisfied'", "value": "#107C10" },
{ "test": "datum.Status == 'Trends'", "value": "#0078D4" }
],
"value": "#666"
},
"tooltip": [
{ "field": "Month", "type": "temporal", "format": "%b %Y","title": "🗓 Month" },
{ "field": "Trend", "type": "nominal" ,
"title": "📈 Trends"},
{ "field": "Difference_Label", "type": "nominal" ,
"title": "🔁 Prev Diff" },
{ "field": "Status", "type": "nominal" ,
"title": "📊 Status"}
]
},
"width": 200,
"height": 30
}
]
}
}
]
}